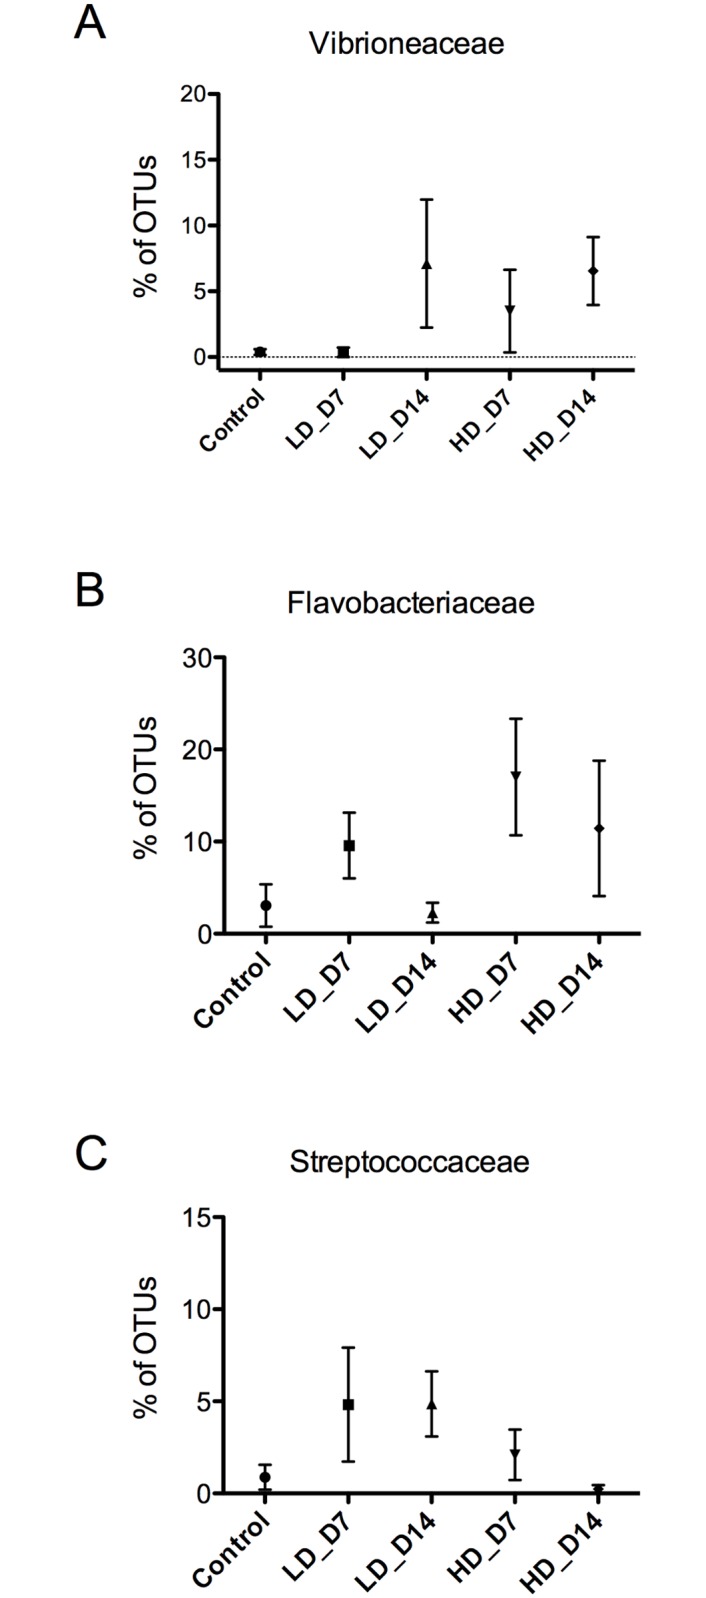
Fig 6. SAV3 infection results in increased abundance of opportunistic pathogens.

Percentage of total OTUs respresented by Vibrionaceae (A), Flavobacteriaceae (B) and Streptococcaceae (C) in control and SAV-infected groups. The P values obtained in the statistical analysis are shown in Table 2. LD_D7: low-dose infected day 7; LD_D14: low-dose infected day 14; HD_D7: high-dose infected day 7; HD_D14: high-dose infected day 14.
