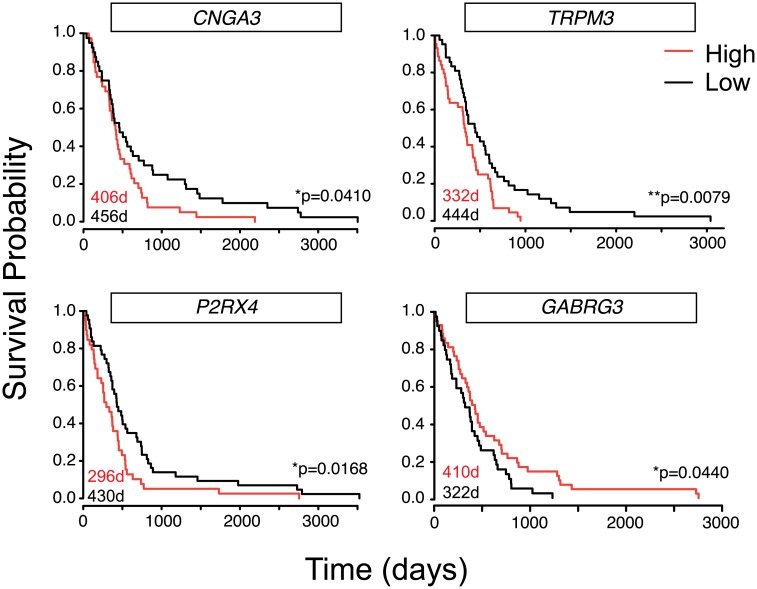
Fig 3. IGCs are associated with poor clinical outcomes.
Expression levels of IGCs were identified from 525 TCGA bulk GBM microarray expression samples. Samples for which expression levels were highest and lowest (top and bottom 10%) were then compared for time to death. Median days to death for each group reported on graph.

