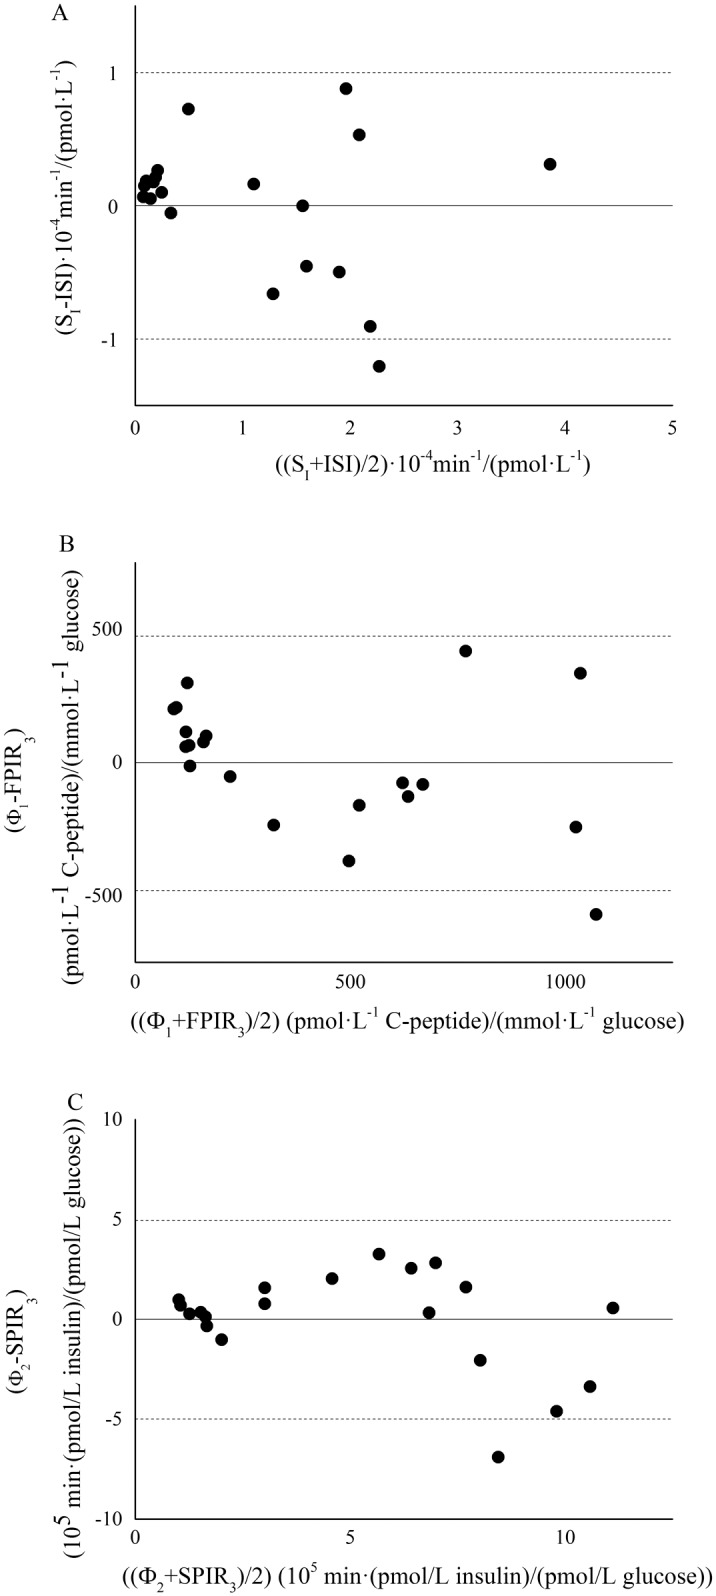
Fig 7. Bland-Altman plots for corrected ISI and SI (panel A), corrected FPIR3 and Φ1 (panel B), corrected SPIR3 and Φ2 (panel C).

Dashed lines represents limit of agreement (mean ± 1.96 SD).

Dashed lines represents limit of agreement (mean ± 1.96 SD).