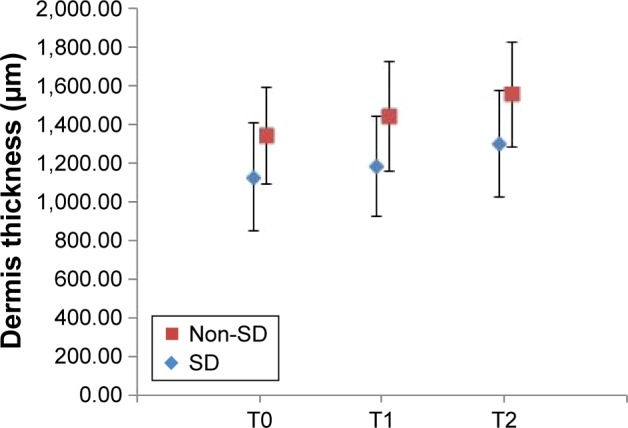
Figure 4.

Relative changes in dermis thickness values during the study (mean ± standard deviation).
Notes: T0 – baseline determination, T1 – after 3 weeks, T2 – after 6 weeks of cream application; non-SD – subgroup without striae (N=10, P=0.0000486709), SD – subgroup with striae (N=10, P=0.0000455191).
Abbreviation: SD, striae distensae.
