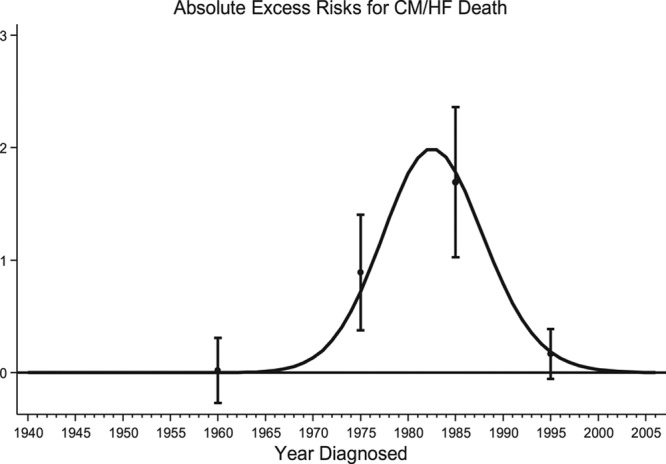
Figure 2.

Absolute excess risk per 10 000 person-years for cardiomyopathy/heart failure (CM/HF) deaths for each calendar year of diagnosis. The curve was produced by fitting a restricted cubic spline with the number of CM/HF deaths per 1 calendar year band as a weight. Point estimates of the absolute excess risk with corresponding 95% confidence intervals are plotted at the mean of the relevant treatment era (1940–1969, 1970–1979, 1980–1989, and 1990–2006).
