. 2017 Feb 23;6:e22431. doi: 10.7554/eLife.22431

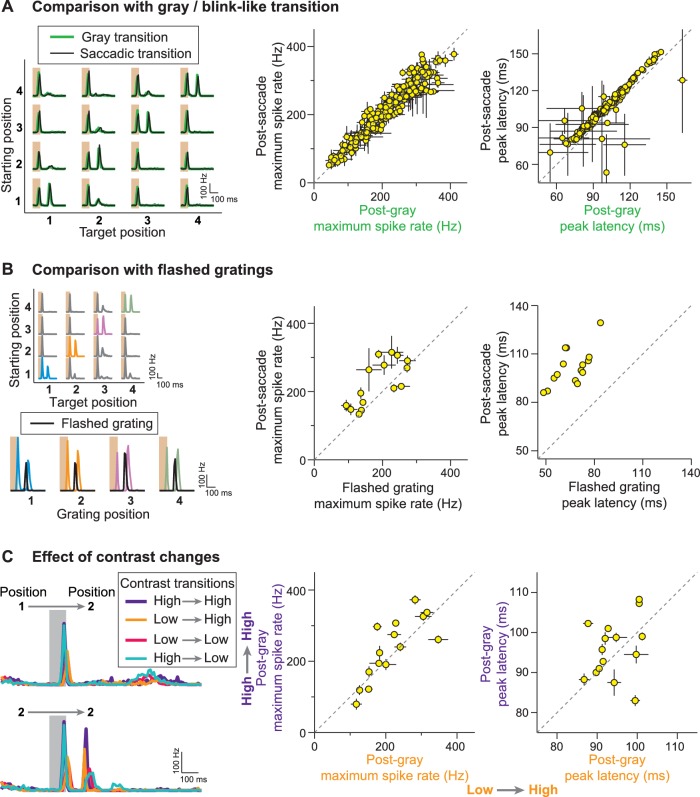
Figure 3. Stimulus history dependence of IRS responses.

(A) Comparison of responses from a sample IRS cell (left) for saccade-like transitions (black traces) and transitions masked by a gray screen of mean illumination (green traces) as well as population analysis of the maximum firing rate and its latency for the two transition types (right). For the population analysis, each data point represents the average for a single cell over the four grating positions with equal starting and target position, and error bars denote standard errors, but are smaller than the symbol size for many data points (N = 209 cells from 48 recordings). (B) Comparison of responses from a sample IRS cell (left) for saccade-like transitions of a recurrent grating (colored traces) and for flashing the same grating in isolation (black traces) as well as population analysis as in (A) of the maximum firing rate and its latency (right; N = 15 cells from five recordings). The flashed gratings were preceded by mean-intensity illumination, and their responses were aligned to the onset of the new fixation in the saccade-like transitions. (C) Responses of a sample IRS cell (left) for transitions that included random changes in contrast between a high (60%) and low (30%) level as well as population analysis of the maximum firing rate and its latency as in (A) for the transitions to the high-contrast target images (right; N = 15 cells from five recordings).

DOI: http://dx.doi.org/10.7554/eLife.22431.004

Figure 3.

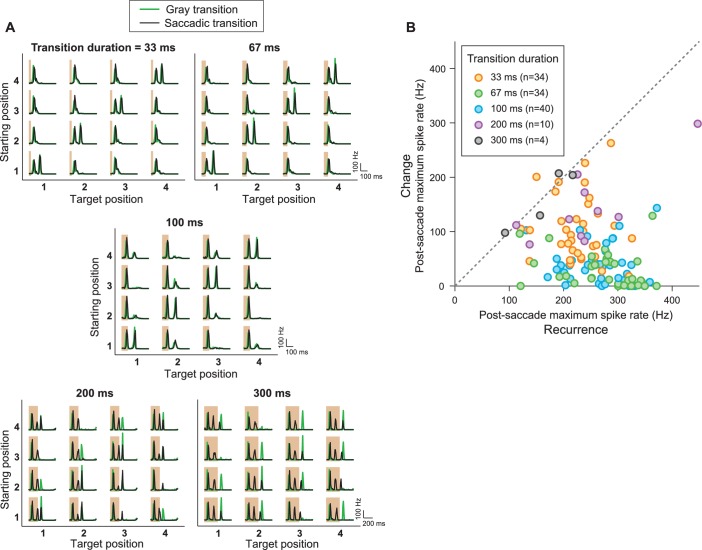
Figure 3—figure supplement 1. IRS responses are robust to variations of transition duration.

Figure 3—figure supplement 1.

(A) Firing rate profiles for a sample IRS cell in response to the saccade stimulus with different durations of the transition period, ranging from 33 ms to 300 ms, for saccadic (black traces) and masked (green) transition. The variations in transition duration were accompanied by corresponding differences in the speed of the saccade-like shifts. The characteristic IRS responses are visible in all cases. Note, though, that longer saccade-like shifts produced additional intermediate activity peaks. Apparently, the sequence of bright and dark illumination is now slow enough so that the neurons can follow and produce transient activation, for example, when the grating position temporarily matches the starting position during the saccadic transition. For example, for 300 ms shifts, the transition from position 1 to 3 yields two response peaks in addition to the transition-onset peak, in agreement with the fact that the transition here goes through 2.5 grating periods. For the transition from position 3 to 1, the grating only goes through 1.5 periods, and there is correspondingly only one additional peak. Furthermore, this explanation is in agreement with the fact that the masked transitions do not lead to intermediate activity peaks. (B) Population analysis of the post-saccade firing rate peaks under ‘Recurrence’ (equal starting and target position) and ‘Change’ (different starting and target position). Data come from a total of n = 40 cells from five recordings, for which typically a subset of transition durations was tested.