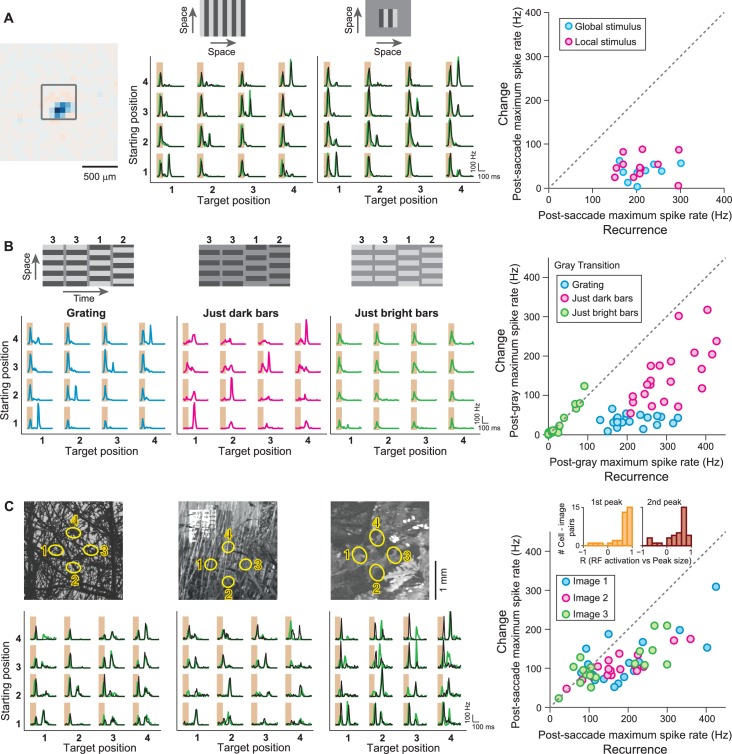
Figure 4. IRS responses are robust to spatial stimulus structure.
(A) Influence of spatial extent of the stimulus. Left: Receptive field of a sample IRS cell. The outlined square shows the region of a local saccade stimulus. Middle: Firing rate profile of the sample IRS cell for the standard saccade stimulus, displayed over the entire screen, and for a smaller stimulation area of 480 µm x 480 µm. Responses under masked transitions by a gray screen are shown in green. Right: Population analysis (N = 12 cells from three recordings). For each recorded IRS cell, the maximum firing rate after onset of the target image was averaged over transitions with equal starting and target position (‘Recurrence’, x axis) and for the other transitions, where starting and target position differed (‘Change’, y axis). (B) Differential effects of bright and dark grating components. Left: Responses from a sample IRS cell to the standard grating stimulus and to gratings that contained only the dark or bright bars, all for transitions with a gray screen. The space-time representations of the stimuli are shown on top. Right: Population analysis (N = 21 cells from five recordings) as shown in (A). (C) Responses of three IRS cells (bottom, black traces) to saccade-like shifts of natural images (top). Ellipses in the images denote the receptive field outlines at the four fixation positions. Transitions lasted 100 ms and either occurred linearly between two fixation positions (starting position different from target position) or were composed of a shift to the center during the first 50 ms, immediately followed by a shift back to the starting position (equal starting and target position). For comparison, responses where the image was blurred during the transition are shown in green. Right: Population analysis of IRS cell responses to three natural images (N = 17 cells from four recordings). Inset: Distributions of correlation coefficients between the size of the first firing-rate peak and the integrated darkening in the receptive field at transition onset (left) as well as between the size of the second firing-rate peak and the integrated darkening in the receptive field at fixation onset (right).


