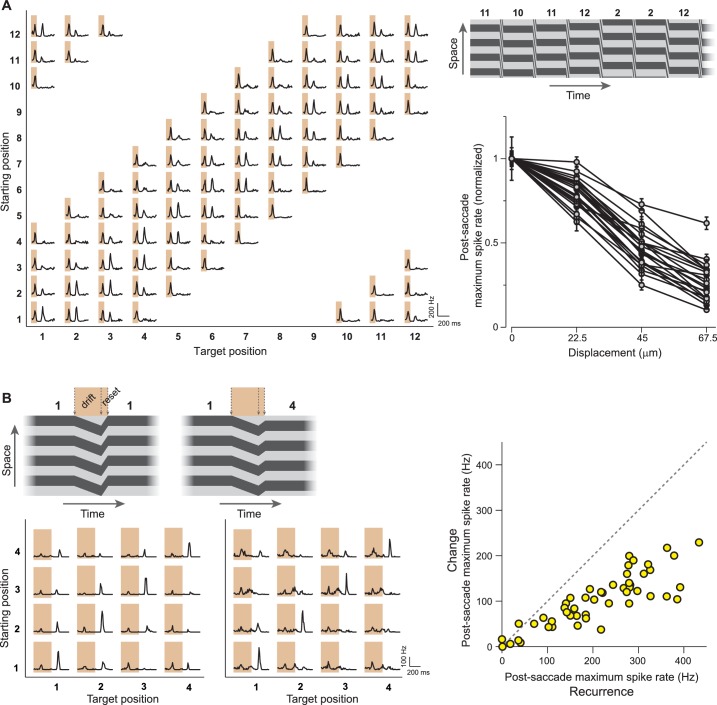
Figure 5. IRS responses are sensitive to small net translations and microsaccade-like image resets.
(A) Left: Responses of a sample IRS cell to a stimulus with fine net displacements between starting and target position, corresponding to a resolution of 30° of grating phase or 22.5 µm translation on the retina. Top right: Space-time representation of the stimulus. Bottom right: Population analysis of the dependence of the averaged post-transition maximum firing rate on the net displacement between starting and target image (N = 22 cells from seven recordings). Firing rates were normalized to the value obtained for zero net displacement, and error bars correspond to standard errors. Lines connect data points of individual IRS cells. (B) Left: Responses of two IRS cells (bottom) to drift-reset stimulus motion, as schematically depicted on top, which can represent a correct reset (left) or a reset that is too short (right) or too far. Right: Population analysis of responses to the drift-reset stimulus (N = 50 cells from five recordings).

