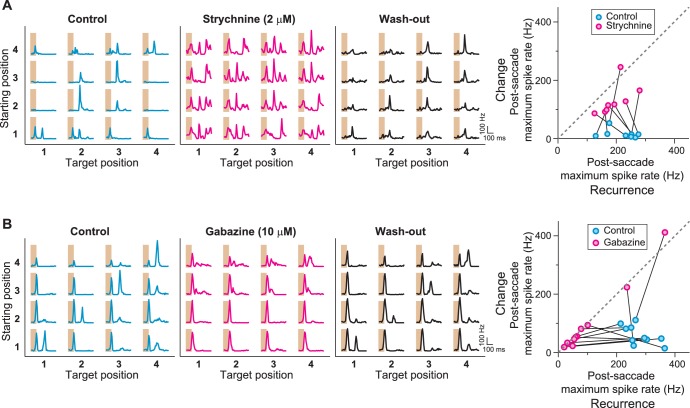
Figure 7. Role of GABAA- and glycine-mediated inhibition in generating IRS responses.
(A) Left: Firing rate profile of a sample IRS cell before, during, and after application of the glycine blocker strychnine. Right: Comparison of responses before (blue) and during drug application (magenta) for all recorded IRS cells. For each cell and condition, the maximum firing rate after onset of the target image was averaged over transitions with equal starting and target position (‘Recurrence’, x axis) and for transitions with different starting and target positions (‘Change’, y axis). Connected data points come from the same cell (N = 8 cells from three recordings). (B) Firing rate profiles of a sample IRS cell before, during, and after application of the GABAA blocker gabazine. Right: Comparison of responses before (blue) and during (magenta) drug application for all recorded IRS cells as in (A) (N = 10 cells from three recordings). The two cells with strong spike rate increases under gabazine for transitions of the ‘Change’ type displayed a strong broadening of the first response peak into the post-transition analysis window, but did not show distinct second response peaks.

