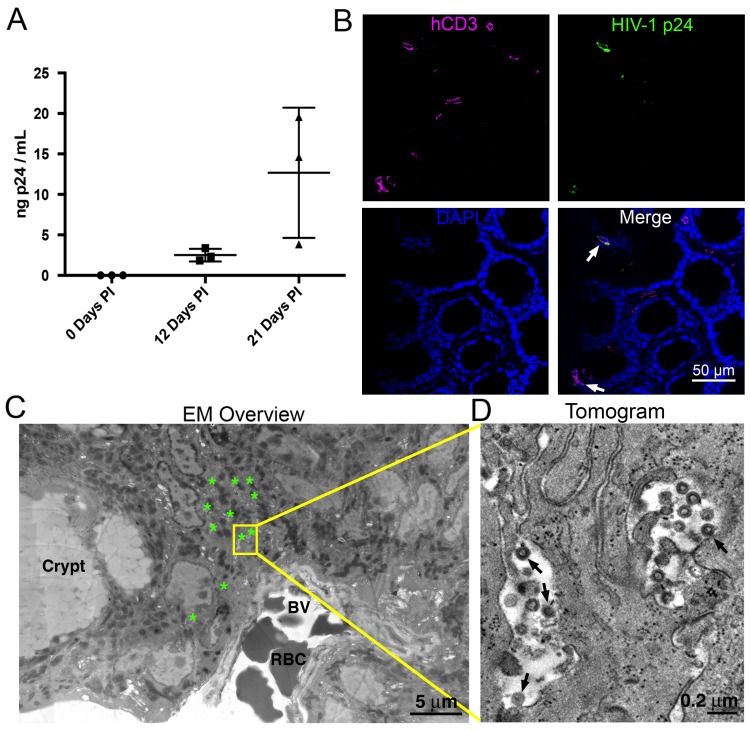
Figure 1. HIV-1 infection and Imaging of hu-mice.
(A) Mean blood p24 levels from three HIV-1–infected PBMC-NSG mice assessed at 0, 12, and 21 days PI. Error bars represent standard deviation. (B) IF of GALT from HIV-infected animal with highest blood p24 level from panel A at 21 days PI. Samples were stained for human CD3 (magenta), HIV-1 p24 (green), and nuclei (blue). White arrows indicate human CD3+/p24+ cells. (C) Montaged projection EM overview of colon crypt region from the same animal. Areas with virus are highlighted (green asterisks) along with a region of interest for imaging by ET (yellow box). Virus was found in close proximity to a blood vessel (BV) containing red blood cells (RBCs). (D) Tomographic slice of region of interest from panel C showing separate pools of free virus on two sides of an infected cell. Black arrows indicate budding virions.
DOI: http://dx.doi.org/10.7554/eLife.23282.002

