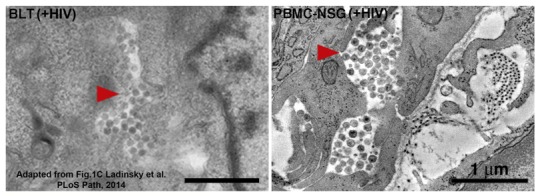
Author response image 2. Equivalent tomographic slices of colon crypt regions from HIV-1-infected BLT (left) or PBMC-NSG (right) hu-mice.

Free virions are visible at similar levels and locations in both models (red arrows = pools of free virions).

Free virions are visible at similar levels and locations in both models (red arrows = pools of free virions).