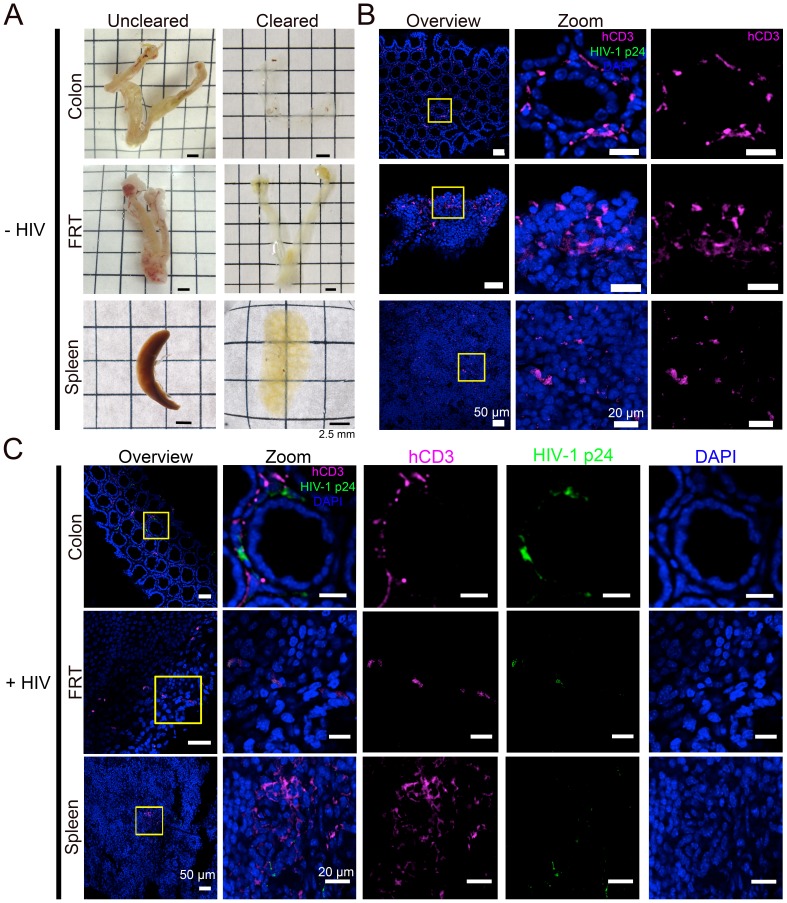
Figure 2. Tissue clearing and IF imaging of lymphoid tissues.
(A) Representative images of uncleared (left) and cleared (right) lymphoid tissues from uninfected hu-mice. (B, C) Confocal images of cleared lymphoid tissues from uninfected (panel B) and HIV-1–infected (28 days PI) (panel C) hu-mice stained with antibodies against human CD3 (magenta) and HIV-1 p24 (green). Nuclei were labeled with DAPI (blue). Scale bars for overview images = 50 μm. Scale bars for zoomed views = 20 μm.

