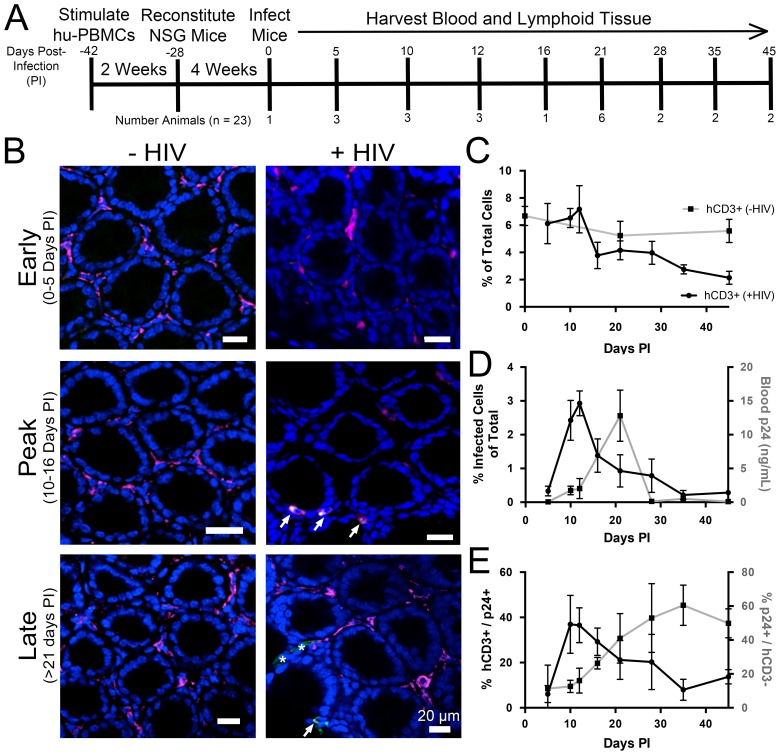
Figure 3. Longitudinal quantification of GALT infectivity.
(A) Timeline of immune cell reconstitution, HIV-1 infection, and tissue harvest from hu-mice. Top numbers depict days PI, bottom numbers show number of animals per timepoint. Single uninfected animals were sacrificed at 0, 21, and 45 days PI. All other animals were infected and sacrificed at the times indicated. (B) Representative images showing human CD3+ T-cells (magenta), HIV-1 p24 (green), and nuclei (blue) in colon at early (0–5-days PI), peak (10–16 days PI), and late (>21 days PI) infectivity. Arrows indicate infected cells. Asterisks show p24 not associated with human CD3+ T-cells. (C–E) Error bars represent standard deviation. n > 5000 cells from 1–3 animals for all time points. (C) Quantification of human CD3+ T-cells as the percent of total cells for HIV-1–infected (black line) or uninfected (gray line) animals. (D) Comparison of GALT infectivity as percent infected cells of total (black line, left Y-axis) with blood p24 (gray line, right Y-axis, ng/mL) levels over time. (E) Longitudinal profile of percent HIV-1 p24-positive human CD3+ T-cells (black line, left Y-axis) and percent of p24 signal not associated with human CD3+ T-cells (gray line, right Y-axis).
DOI: http://dx.doi.org/10.7554/eLife.23282.005


