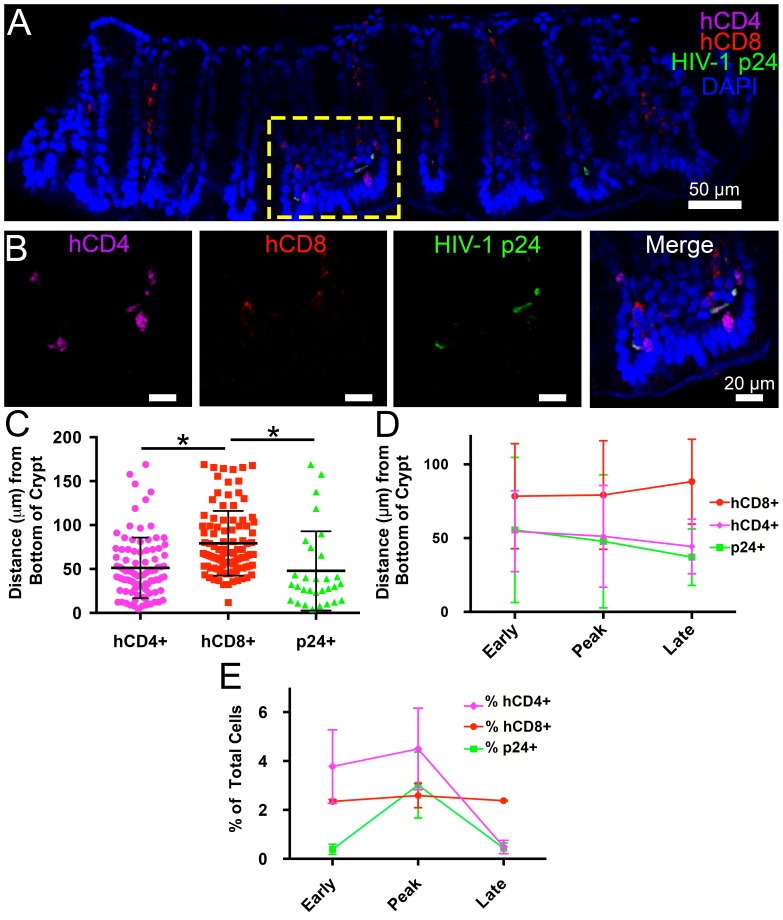
Figure 4. Spatial distribution of HIV-1 infection in GALT over time.
(A) Representative confocal slice from 45 μm Z-stack depicting the distribution of human CD4+ T-cells (magenta), HIV-1 p24 (green), human CD8+ T-cells (red) and nuclei (blue) in colon at 12-days PI. (B) Zoom of boxed region in panel A showing individual channels and merged view for human CD4+ T-cells, human CD8+ T-cells, and p24. (C–E) Error bars represent standard deviation. (C) Quantification of Z-stack from panel A showing the distance (μm) from the base of crypts of human CD4+ T-cells (magenta), human CD8+ T-cells (red), and p24+ T-cells (green) for the volume in panel A. * indicates p<0.0001 (unpaired t-test with Welch's correction, two-tailed). (D) Quantification of distance (μm) from the base of crypts for human CD4+ T-cells (magenta), human CD8+ T-cells (red), and p24+ T-cells (green) for individual volumes during times of early, peak, and late infectivity. n > 2000 total cells for each volume. (E) Quantification of CD4+ T-cells (magenta), human CD8+ T-cells (red), and p24+ T-cells (green) as a percentage of total cells at early, peak, and late infectivity times. n > 5000 total cells for each time point.
DOI: http://dx.doi.org/10.7554/eLife.23282.010

