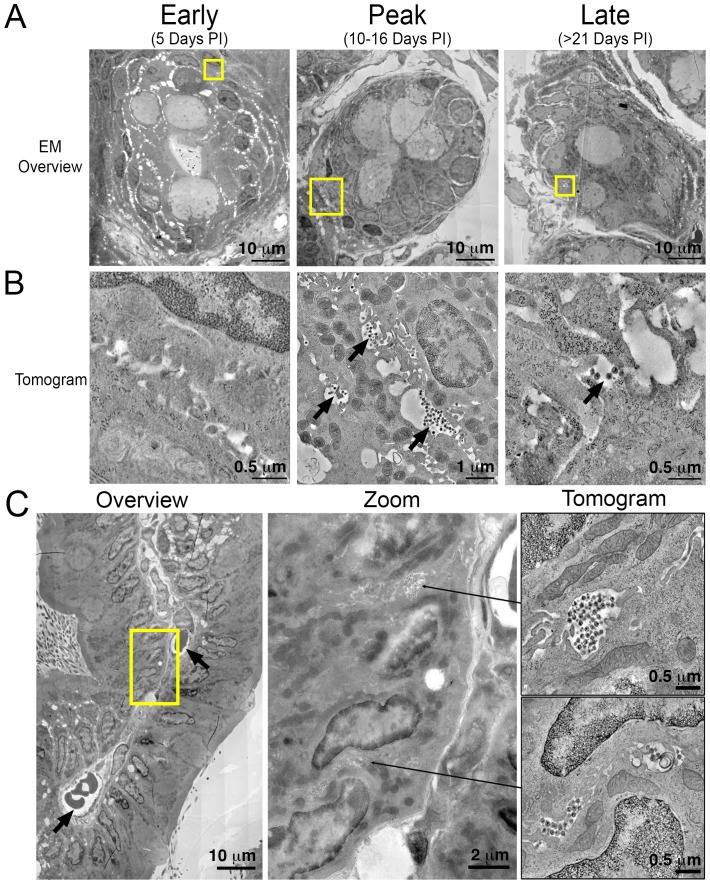
Figure 5. Electron tomography of longitudinal HIV-1 spread in GALT.
(A, B) Montaged overview EM projection images (panel A) and zoomed tomographic slices (panel B) of HIV-1–infected colon crypts from hu-mice from early (5 days), peak (10–16 days), and late (>21 days) time points PI. Arrows indicate pools of free virions between cells. (C) Lamina propria from HIV-1 infected GALT 10 days PI. Left: montaged overview EM projection image showing lamina propria in cross-section. Arrows indicate blood vessels containing red blood cells. Yellow box indicates zoomed region of interest depicted in middle panel. Zoomed region from overview reveals pools of virus adjacent to vasculature. Right: tomographic slices of two indicated regions (arrows) that reveal pools of virus contiguous with blood vessel walls connected by lateral intercellular space.

