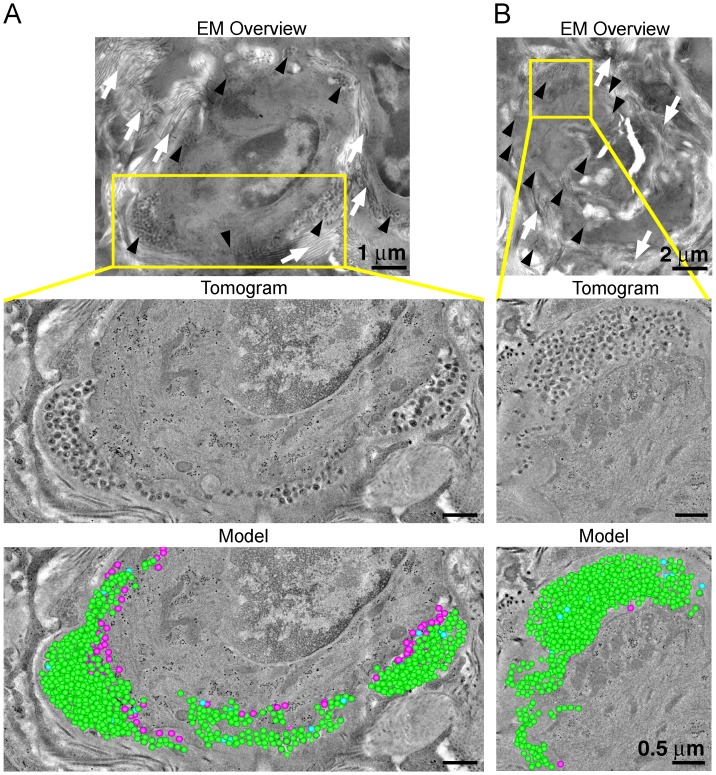
Figure 7. ET and modeling of HIV-1 Infection in spleen.
(A and B) EM projection images of HIV-1-infected cells from regions of spleen from an HIV-1-infected animal 12-days PI (top panels). Collagen fibrils (white arrows) and pools of virions (black arrows) surround the infected cells. Yellow boxes indicate regions of tomographic reconstruction. Tomographic slices show zoomed detail of infected cells (middle panels). Modeled mature (green), immature (blue), and budding (magenta) virions from the full volume of tomographic reconstructions (bottom panels). Scale bars for tomogram and model panels are 0.5 m.

