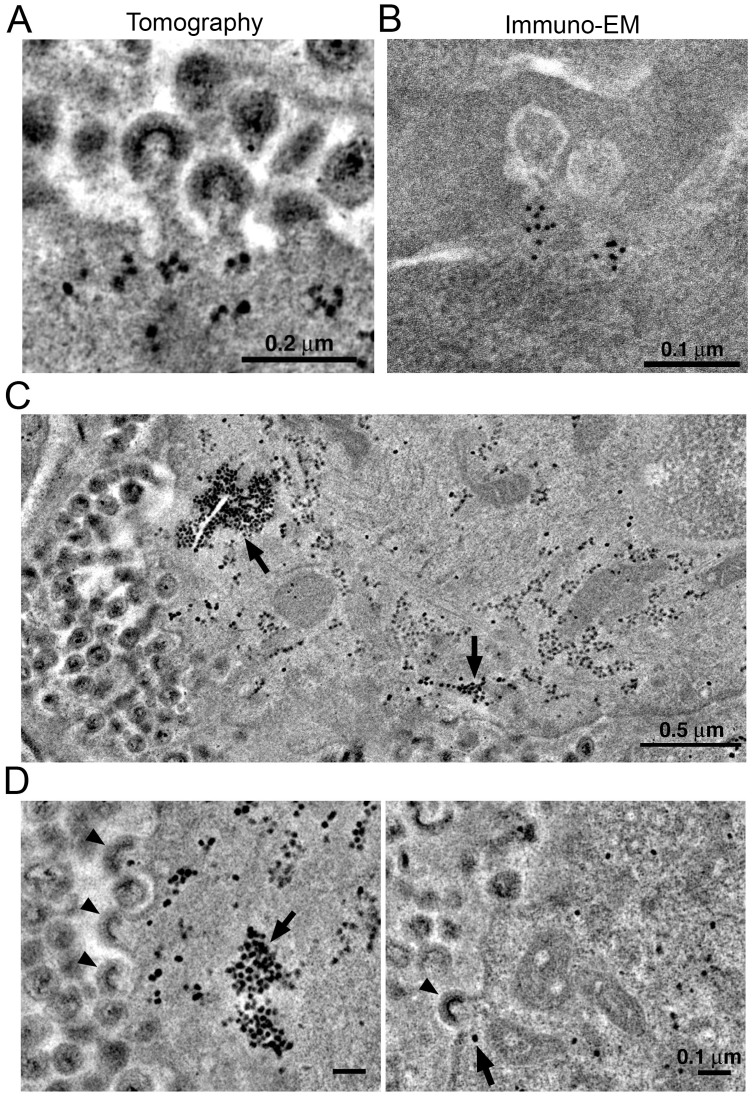
Figure 8. Localization of HIV-1 budding machinery.
(A) Densities localized to the base of budding virions. (B) Anti-VPS4A immuno-EM revealing localization patterns consistent with densities in panel A. (C) Tomographic slice of HIV-1–infected spleen 12 days PI showing large accumulations of densities (black arrows) adjacent to regions of prolific virus release. (D) Tomographic slices showing budding virions from the animal in panel C revealing prolific budding (left) or low levels of budding (right). Arrowheads indicate budding virions and arrows indicate densities.

