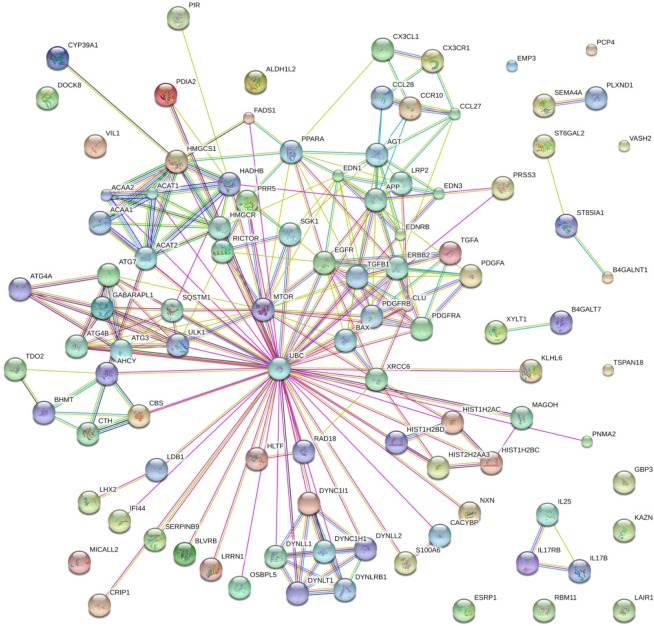
Figure 3.
Genetic interaction network associated with carfilzomib resistance in multiple myeloma based on String platform. In this picture, each circle represents a gene (node) and each connection represents a direct or indirect connection (edge).
Note: Line color indicates the type of interaction evidence and line thickness indicates the strength of data support.

