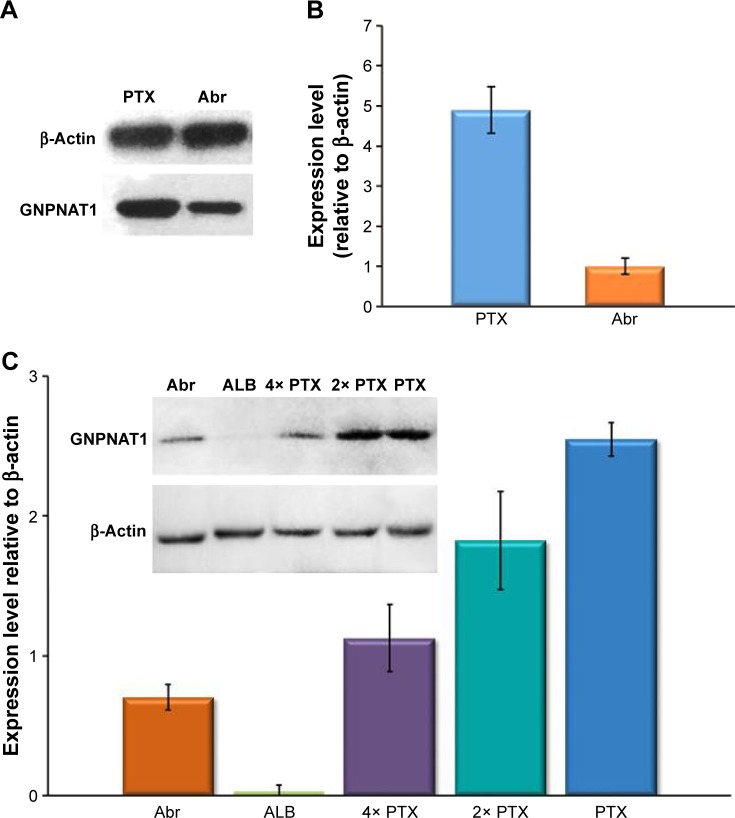
Figure 4.
Western blotting validation of the protein glucosamine 6-phosphate N-acetyltransferase 1 (GNPNAT1/GNA1).
Notes: One-way ANOVA was used for statistics. (A) Blots for PTX and Abr groups were representatives of at least three independent experiments. (B) Densitometry analysis of the Western blots. The intensities of each test protein band were normalized against the corresponding β-actin blot bands. For PTX and Abr groups, P<0.01. (C) Pure ALB, 2 and 4 fold of PTX were added in the analysis. The inset represents blots, and the bar diagram shows the intensities of each test protein band normalized against the corresponding β-actin blot bands. ALB group was significantly different from all the left groups Abr, PTX, 2PTX, and 4PTX, (P<0.001), and the PTX group was significantly different from the Abr group (P<0.01).
Abbreviations: Abr, Abraxane; ALB, albumin; ANOVA, analysis of variance; PTX, paclitaxel.

