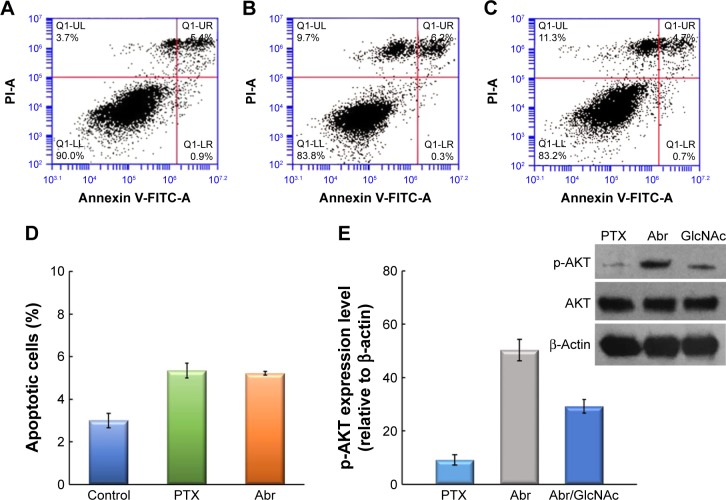
Figure 8.
Cell apoptosis and AKT and p-AKT expression analysis.
Notes: (A–C) A549 cells were treated with PTX and Abr for 24 h. Apoptotic cells percentage was detected by annexin V/PI staining with flow cytometry analysis. (D) Apoptotic cells (positive for annexin V and negative for PI) were distributed in the lower and right panels. Each column was the average percentage of three independent trials and is presented as mean ± standard deviation. Compared with the control group, drug treatment significantly increased the percentage of apoptotic cells (P<0.05). (E) Activated AKT in Abr-treated cells. Western blot analysis of lysates from PTX, Abr, and Abr +10 mM GlcNAc. Bands were quantified using a densitometer. Levels of P-AKT were plotted as a percentage of β-actin. Abr group was significantly different from the PTX group (P<0.01).
Abbreviations: Abr, Abraxane; FITC, fluorescein isothiocyanate; GlcNAc, N-acetylglucosamine; p-AKT, phosphor-AKT; PI, propidium iodide; PTX, paclitaxel.

