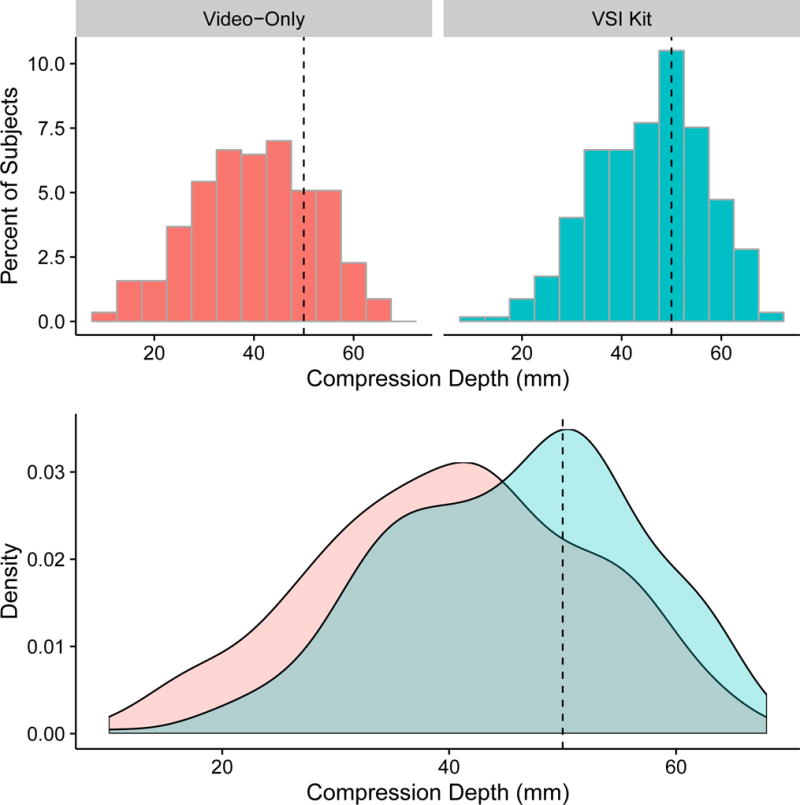
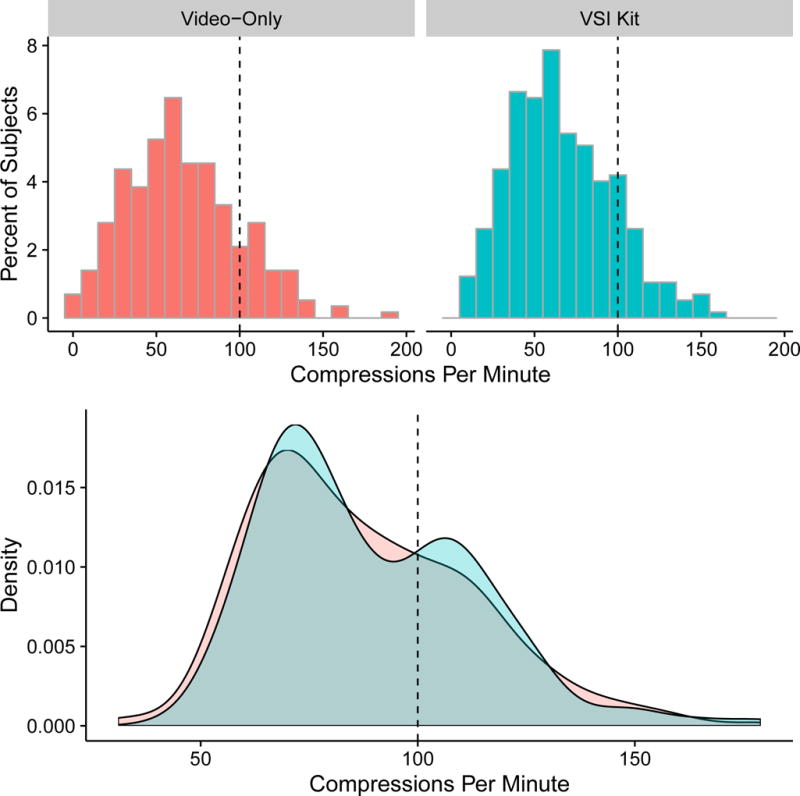
Figure 2.


Histograms of A) chest compression rate and B) depth in VO and VSI stratified by training group. Vertical dashed lines show target rates of 100 compressions per minute and 50 mm respectively. The lower panel in each frame conveys the data from the two histograms overlaid, and smoothed with a kernel density estimator
