
Figure 1.
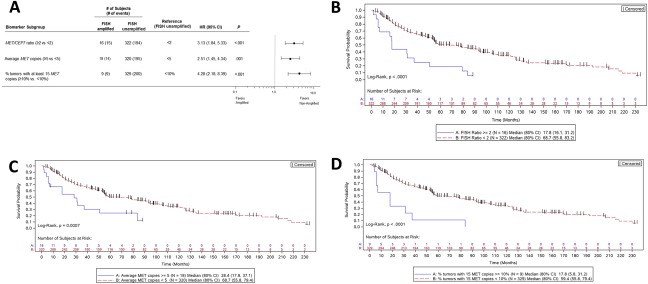
Patient risk and overall survival as assessed by the MET FISH status. (A) Cox proportional hazards model evaluation of FISH classification with respect to overall survival. HRs along with 95% CIs are depicted for MET‐amplified tumors versus unamplified tumors as characterized by 3 separate criteria. (B‐D) Kaplan‐Meier curves depicting the overall survival of subjects with MET‐amplified tumors versus unamplified tumors as characterized by (B) the MET/CEP7 ratio, (C) the average gene copy number, and (D) the percentage of tumor cells containing at least 15 copies of MET. CEP7 indicates centromere enumeration probe for chromosome 7; CI, confidence interval; FISH, fluorescence in situ hybridization; HR, hazard ratio.