
Figure 4.
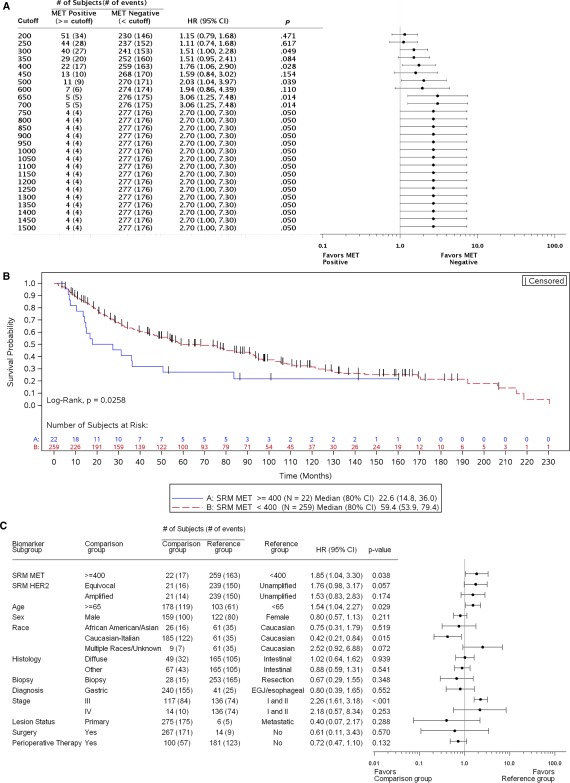
Patient risk and overall survival as assessed by Met SRM expression. (A) Cox proportional hazards model evaluation of Met SRM quantitation with respect to overall survival. HRs along with 95% CIs comparing Met‐positive and Met‐negative patients at each cutoff value are depicted. The number of MET‐amplified tumors present within each Met‐positive cutoff group is presented. (B) Kaplan‐Meier curves depicting the overall survival of subjects by Met SRM expression with 400 amol/μg as the Met‐positive cutoff. (C) Cox proportional hazards model evaluation of Met SRM expression with respect to overall survival. A multivariate analysis was performed, and 400 amol/μg was used as the Met‐positive cutoff. HRs along with 95% CIs for each baseline covariate are depicted. CI indicates confidence interval; HER2, human epidermal growth factor receptor 2; HR, hazard ratio; SRM, selected reaction monitoring