
Figure 5.
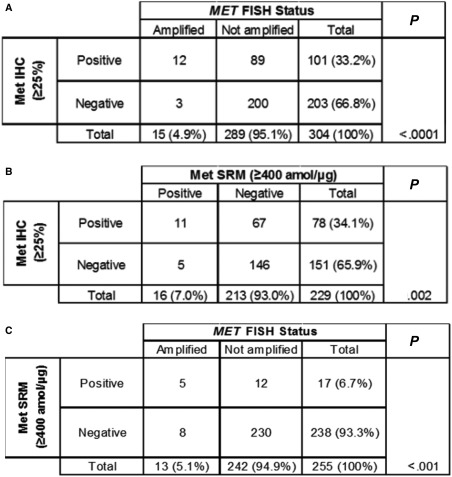
Correlation of MET/MET analytical approaches. MET gene amplification results were compared with (A) Met IHC and (C) Met SRM cutoff–derived protein expression; (B) the correlation between Met IHC and Met SRM was also examined. FISH indicates fluorescence in situ hybridization; IHC, immunohistochemistry; SRM, selected reaction monitoring.