
Figure 11.
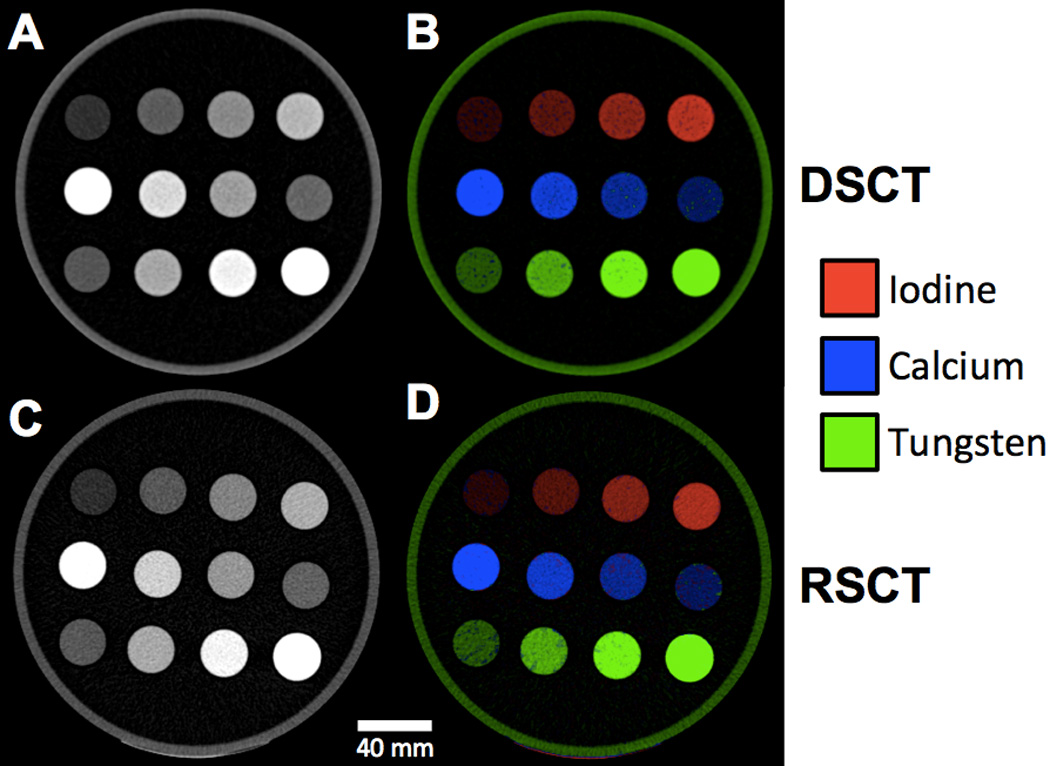
Axial CT images of the tungsten-calcium-iodine phantom configuration. Top row: Pure iodine solutions with increasing concentrations left to right. Middle row: Pure calcium solutions with increasing concentrations right to left. Bottom row: Pure tungsten solutions with increasing concentration left to right A) Unprocessed 80-Sn140 kVp blended image scanned at DSCT. B) Color-coded extracted material image from DSCT. C) Unprocessed 70 keV VMS image scanned at RSCT. D) Color-coded extracted image from RSCT.