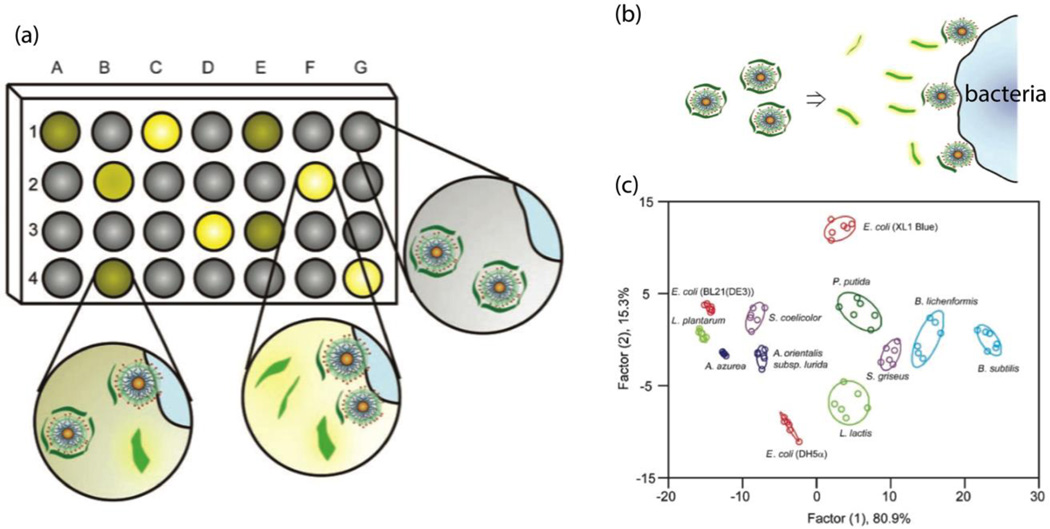
Fig. 12.
(a) Schematic illustration of the signal pattern generation using array-based sensing. (b) Schematic representation of the detection of bacteria strains using turning-on fluorescence array sensors. (c) Canonical score plot for the fluorescence array patterns calculated using LDA. Reproduced with permission from ref. 46. Copyright 2008, WILEY-VCH Verlag GmbH & Co. KGaA, Weinheim.

