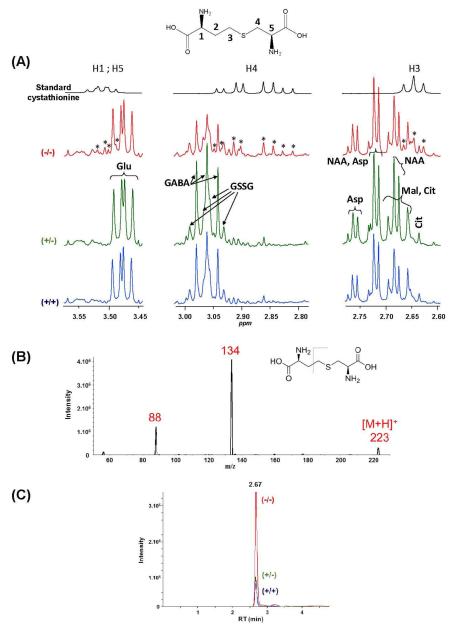
Figure 2.
(A) Comparison of 1H NMR spectra (zooms around 2.7, 2.9 and 3.5 ppm) of a solution of standard cystathionine and of aqueous brain extracts from Akp2+/+ (blue), Akp2+/− (green) and Akp2−/− (red) mice. *: signals fitting with those of cystathionine standard. Abbreviations of metabolites: see caption of Figure 1. (B) Full scan MS spectrum of standard cystathionine. (C) UHPLC-MS/MS chromatograms by SRM (223 →134 transition).

