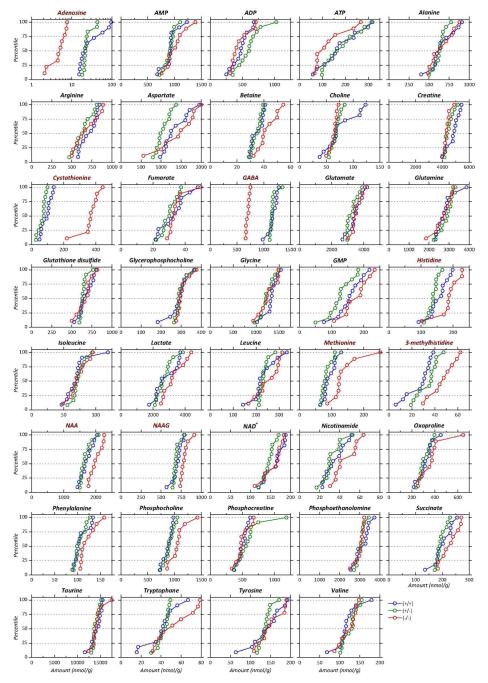
Figure 4.
Cumulative distributions of the concentrations of the 39 metabolites identified for the 3 groups of mice: Akp2+/+ (blue), Akp2+/− (green) and Akp2−/− (red). Metabolites have been ordered alphabetically. Names in red correspond to metabolites whose concentration differed significantly between Akp2−/− and Akp2+/+ and +/− mice. Note log scale for adenosine.

