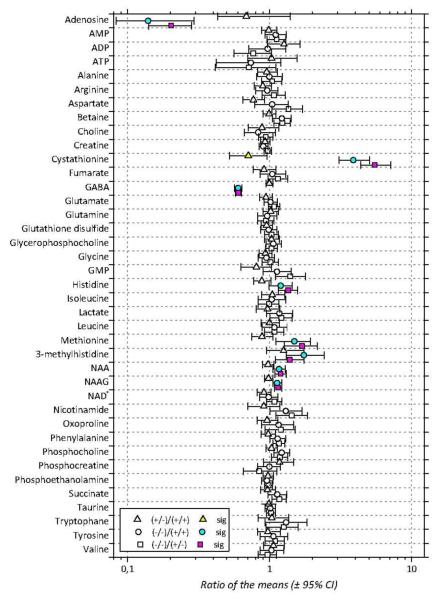
Figure 5.
Ratios of the mean concentrations for the 39 metabolites identified in aqueous extracts of Akp2+/+ (+/+), Akp2+/− (+/−) and Akp2−/− (-/-) mice brains. Symbols correspond to the actual ratio and bars encompass the 95% confidence interval of the ratio. Triangles represent the Akp2+/−/Akp2+/+ ratios, squares the Akp2−/−/Akp2+/− ratios and circles the Akp2−/−/Akp2+/+ ratios. Colored symbols indicate significant differences (p<0.05) between Akp2−/− and Akp2+/+ (cyan), Akp2+/− and Akp2+/+ (yellow) and Akp2−/− and Akp2+/− (magenta) mice. Significant differences are typically associated to 95% confidence intervals that do not straddle the unity ratio value.

