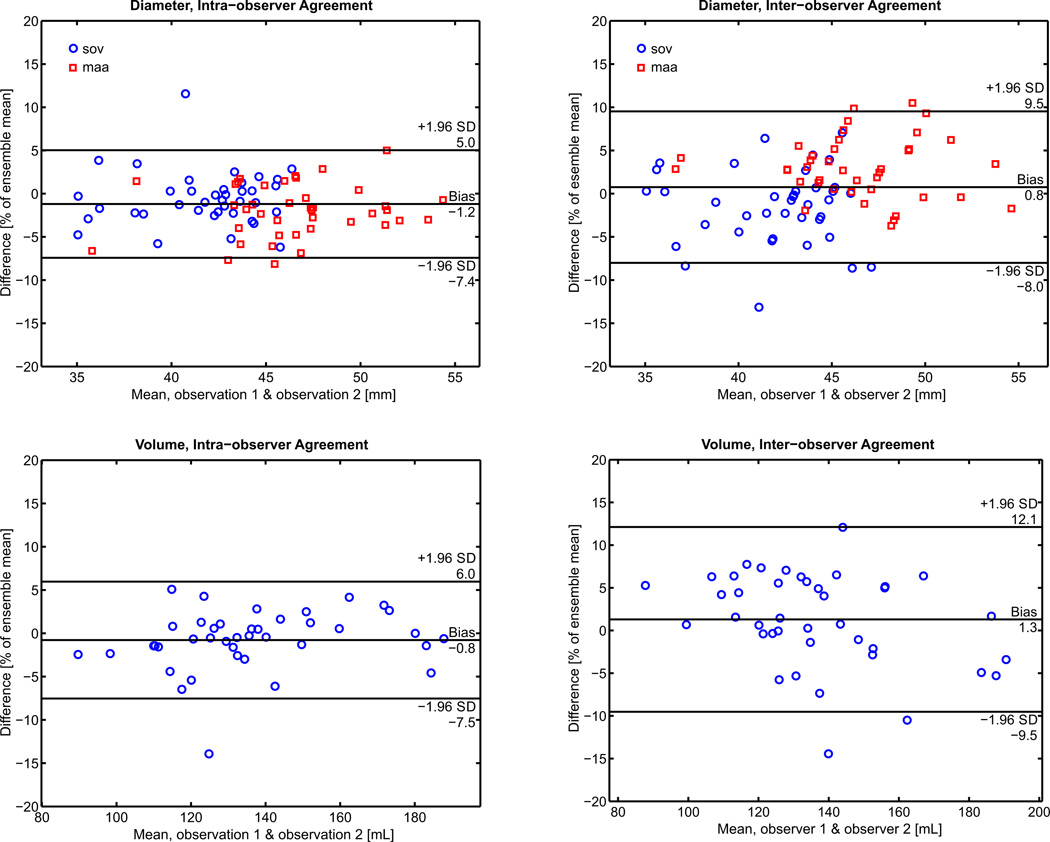
Figure 2.
Interobserver and intraobserver Bland Altman analysis of diameter measurements and volume measurements. Limits of agreement and bias are reported on the horizontal bars as a function of the percent of the ensemble mean. Note: the values for the limits of agreement of the individual MAA and SOV measurements are reported in the results section.

