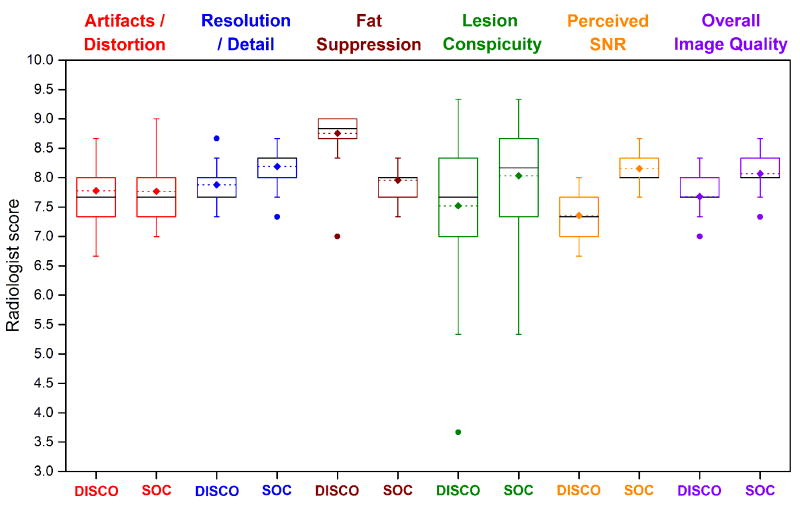
Figure 4.
Boxplot of the mean reader scores per patient for all image quality categories. Median (black lines), mean (dotted lines with diamonds), and outliers (dots) are indicated. Whiskers represent 1.5 times the interquartile range. Images were scored as 6 or higher for both DISCO and the standard-of-care method in all categories with the exception of three cases for the DISCO method and one case for the standard-of-care method which all scored below 6 for lesion conspicuity.

