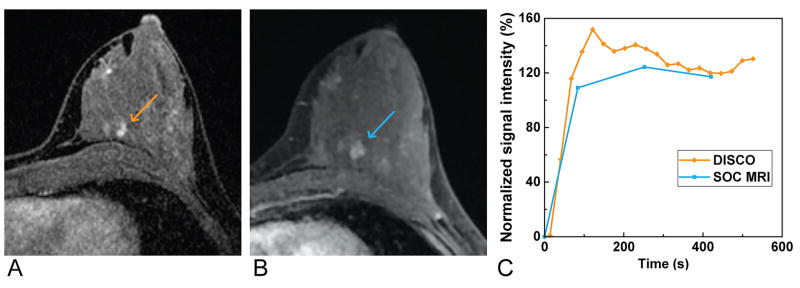
Figure 6.
Magnified and cropped region from an axial slice from a T1-weighted post-contrast time frame from a single patient obtained using DISCO (A) and the standard-of-care method (B) demonstrating preserved image quality with DISCO. A plot of the signal intensity-time curve (C) from an ROI placed in one of the lesions in the left breast (arrows) demonstrates multiple additional time points given the better effective temporal resolution, and thus greater signal intensity-time curve detail, obtained using DISCO (orange curve) compared with the standard-of-care method (SOC method, blue curve).

