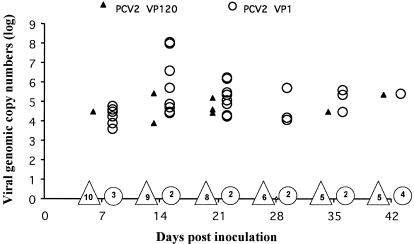
FIG. 3.
Quantitative real-time PCR results of PCV2 VP1 and PCV2 VP120 viral genomic copy numbers in 1 ml of serum sample collected at −1, 7, 14, 21, 28, 35, and 42 dpi from group 1, 2, and 3 pigs. Group 2 pigs inoculated with PCV2 VP120 that were positive for PCV2 DNA (▴) are indicated. The numbers inside the ▵ symbol on the x axis (10, 9, 8, 6, 5, and 5) are the numbers of pigs in group 2 that were negative for PCV2 viremia on the respective dpi. Group 3 pigs inoculated with PCV2 VP1 that were positive for PCV2 DNA (○) are indicated. The numbers inside the ○ symbol on the x axis (3, 2, 2, 2, 2, and 4) are the numbers of pigs in group 3 that were negative for PCV2 viremia on the respective dpi. The PCV2 genomic copy numbers are presented as the log of copy numbers per milliliter of serum (y axis).

