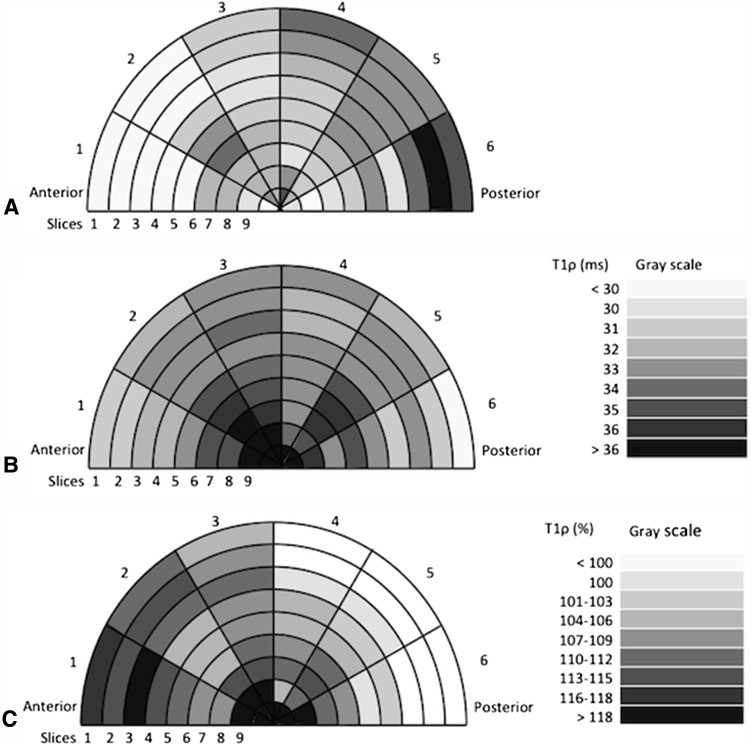
Fig. 3A–C.
T1ρ mapping of cartilage in hips with and without cam morphology showing the difference between the two groups using the original 54 ROIs. The figure illustrates T1ρ values of cartilage in control hips (A), in hips with cam morphology (B), and the difference between the two groups (C) with a gray-coded scale. The nine rings illustrate slices one to nine (lateral to medial). The six wedges illustrate Zones 1 to 6 (anterior to posterior). The bar on the right side decodes the gray scale to the T1ρ values (in ms) or to the difference (in percentage) between hips with and without cam morphology.

