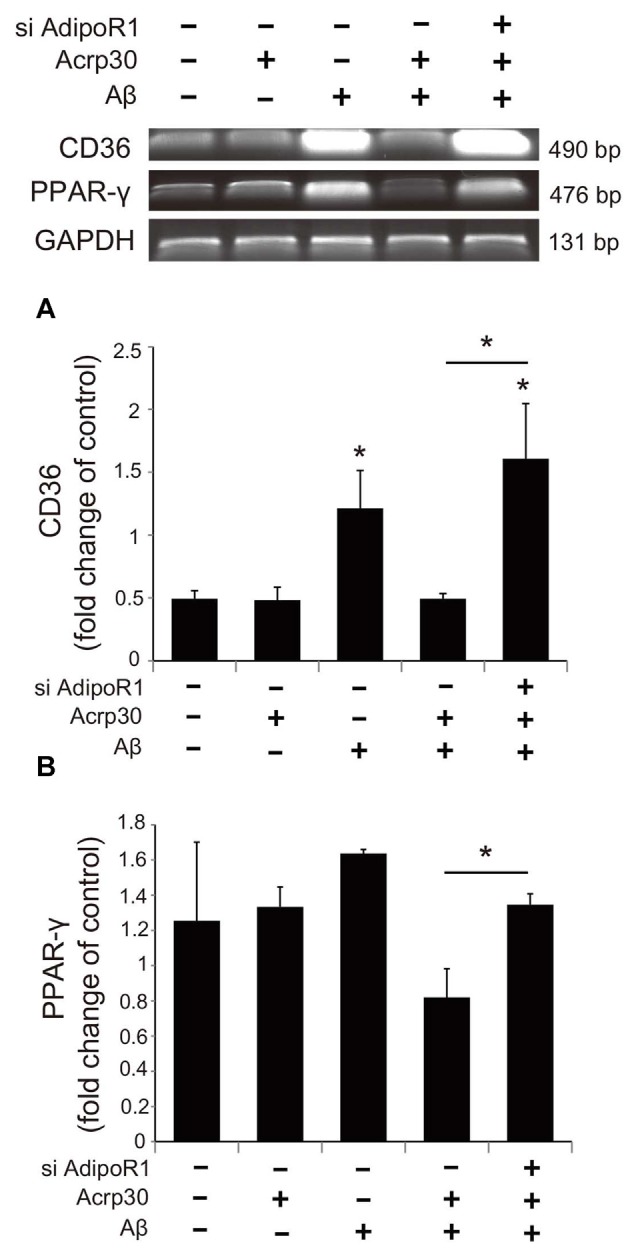
Figure 7.

The expression of CD36 and PPAR-γ in Aβ treated BV2 microglia. The mRNA levels of CD36 (A) and PPAR-γ (B) were checked by RT PCR. The reduced mRNA levels of CD36 and PPAR-γ by Acrp30 in Aβ treated microglia were increased by inhibiting AdipoR1. Data are expressed as mean ± SEM. Each experiment was conducted four times per condition. GAPDH served as a control. Differences were considered statistically significant at *p < 0.05 (compared to control). Acrp30: Acrp30 5 μg/ml pretreatment, Aβ: Aβ 10 μM treatment for 24 h, siAdipoR1: siRNA AdipoR1 transfection.
