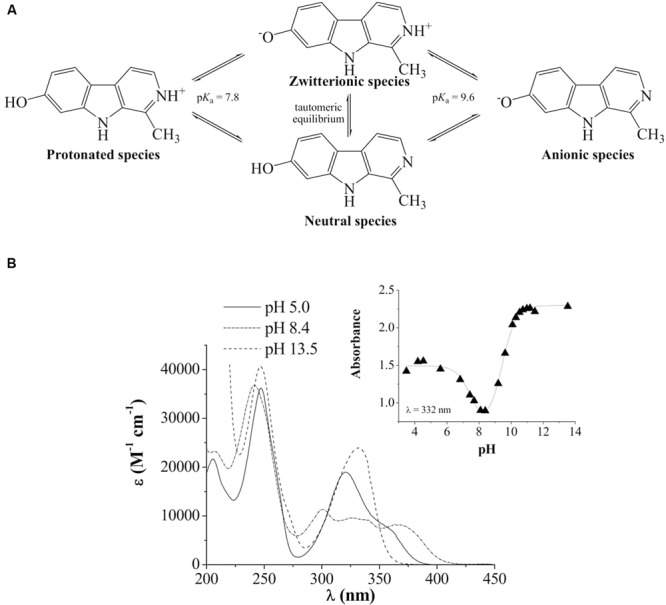
FIGURE 1.

(A) Chemical structure and acid-base equilibria of harmol. (B) UV-visible spectra of harmol in acidic (pH 5), low-alkaline (pH 8.4) and alkaline (pH 13.5) aqueous solutions. Inset: representative example of the spectrophotometric titration curve recorded at the absorption wavelength of 332 nm.
