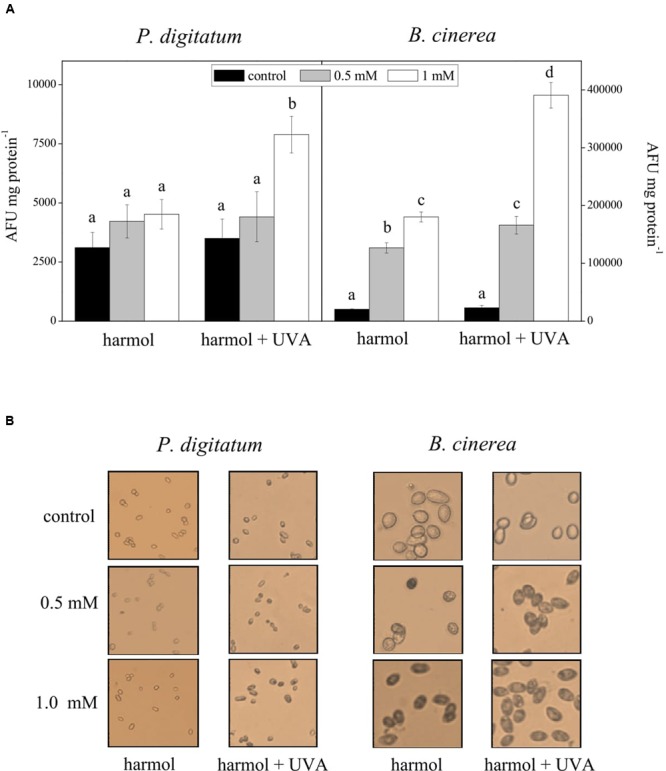
FIGURE 5.

Effect of harmol on production of intracellular ROS. Conidia were treated with harmol at the indicated concentrations, and irradiated or non-irradiated with UVA. (A) ROS quantification using the H2DCFDA fluorescent probe. Data are the average ± SD of three experiments. For each pathogen, different letters indicate significant differences among treatments. AFU, arbitrary fluorescence units. (B) H2O2 in situ detection by staining with 3,3′-diaminobenzidine (DAB). Light microscopy photographs (40×) are representative of three independent experiments. H2O2 accumulation is visualized as dark conidia.
