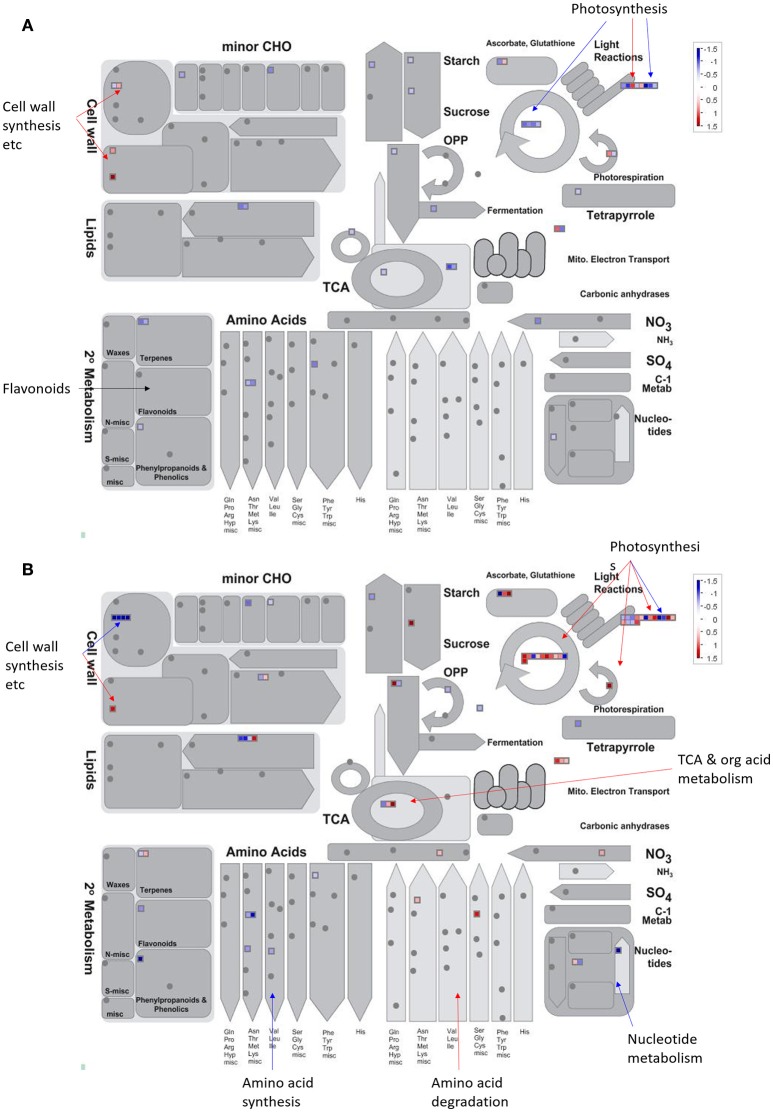
Figure 5.
An overview of the DEPs assigned to “metabolism” by MapMan. Changes of proteomic level in (A) males and (B) females under solar UV-B radiation. Data were processed according to the standard protocol of MapMan software. Red indicates DEPs significantly up-regulated whereas blue indicates down-regulated in response to solar UV-B radiation (see color scale).

