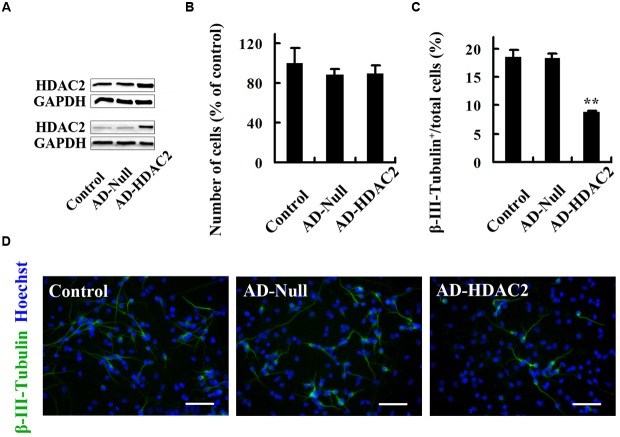
FIGURE 5.
HDAC2 up-expression has no effect on NSC proliferation but reduces neuronal differentiation. (A) Immunoblots showing HDAC2 levels at day 4 after proliferation (top) or differentiation (bottom) of AD-Null- or AD-HDAC2-infected NSCs. (B) Statistical graph showing the number of cells of neurospheres at day 4 after proliferation of AD-Null- or AD-HDAC2-infected NSCs. (C,D) AD-HDAC2 inhibits neuronal differentiation. AD-Null- or AD-HDAC2-infected NSCs differentiated for 4 days and then were fixed for β-III-Tubulin staining. (C) Statistical graph showing the ratio of β-III-Tubulin+ neurons. (D) Example images of β-III-Tubulin+ neurons. Scale bars = 50 μm. Data shown are mean values ± SEM from three experiments in parallel cultures; ∗∗p < 0.01 vs. AD-Null. AD-HDAC2, adenovirus vector selectively expressing HDAC2; GAPDH, glyceraldehyde phosphate dehydrogenase; HDAC2, histone deacetylase 2.

