
Fig. 1.
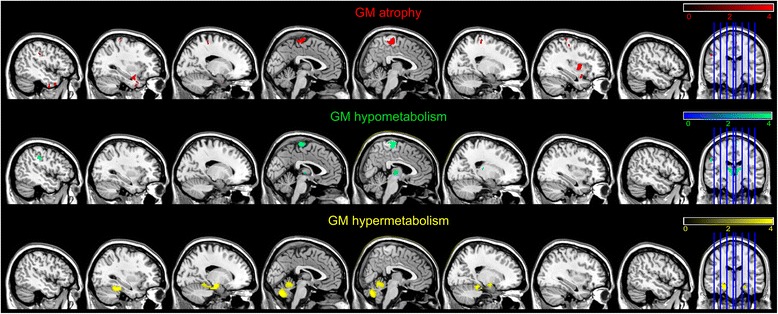
GM atrophy (in red), hypometabolism in (green) and hypermetabolism (in yellow) in patients withamyotrophic lateral sclerosis compared with healthy controls. Between-group comparisons were conductedwith the SPM5 two-sample t test routine. We used a p value cutoff of p < 0.001 uncorrected for multiple comparisons