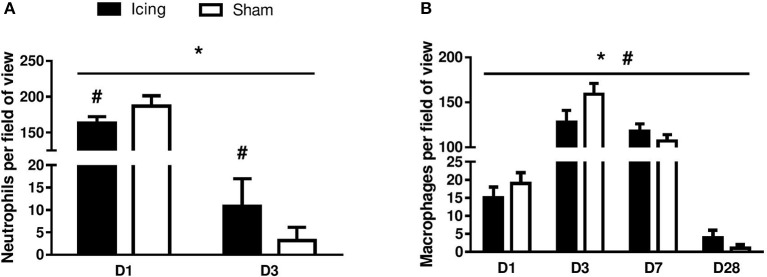
Figure 7.
Quantitative data for neutrophil (A) and macrophage (B) count in skeletal muscle tissue. n = 6 rats per group. Data are mean ± SD and are expressed as a fold-difference from uninjured control rats. Neutrophils and macrophages were not present in skeletal muscle tissue from uninjured control rats. Main effects for neutrophil counts: time (P < 0.001), group (P = 0.029), and group × time interaction (P < 0.001). Main effects for macrophage counts: time (P < 0.001), group (P = 0.008), and group × time interaction (P < 0.001). *P < 0.05 for unpaired t-test vs. uninjured control rats. #P < 0.05 for unpaired t-test vs. sham-treated rats.

