Figure 4.
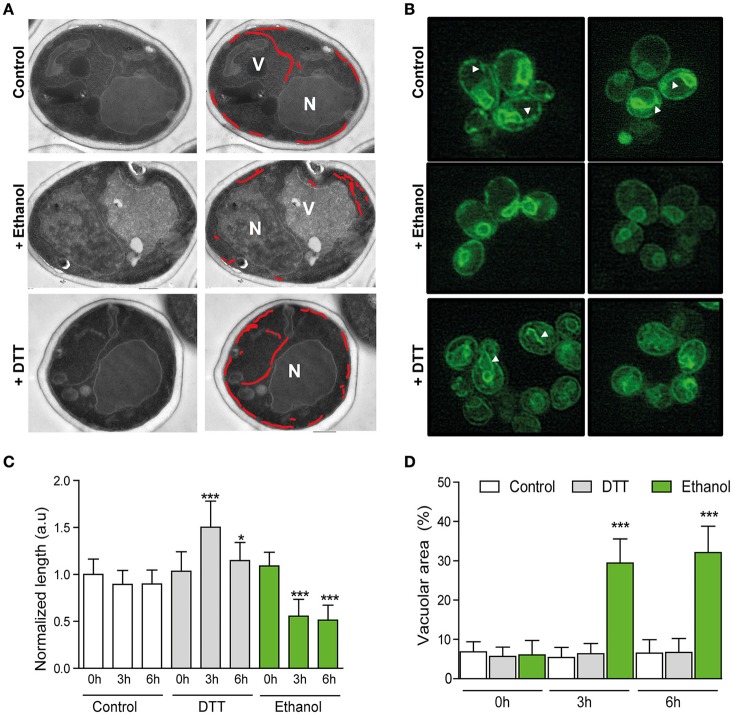
Ultrastructural changes upon ethanol stress do not support unfolded protein accumulation. (A) Cells were subjected to 8% ethanol or 1 mM DTT stress, or to no stress. Samples were obtained after 0, 3, and 6 h. Ultrastructures were observed in ultrathin sections under a transmission electronic microscope. The ER is labeled with a red line, and the nucleus (N) and vacuole (V) are also indicated. (B) ER length was also observed under the same conditions in the BY4741 strain that contained ER marker Sec63-sGfp by fluorescence microscopy. (C) ER length was measured, and quantification in the different conditions was presented as the averages and standard deviations of 30 different images for each condition and time point. (D) % of vacuolar area was similarly measured and quantified in the same samples. Significant differences obtained in the Student's t-test were labelled (*p < 0.01, ***p < 0.0001).

