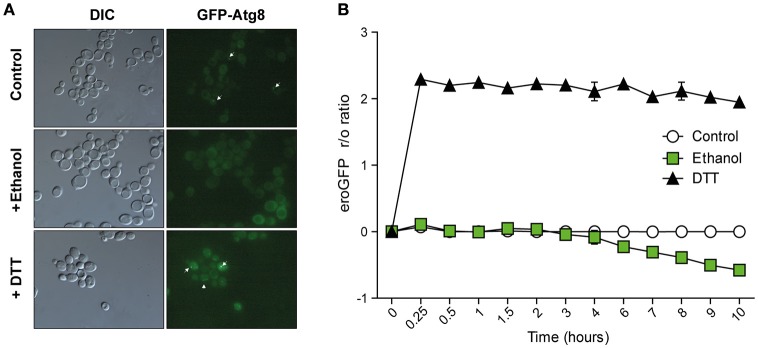
Figure 5.
Cellular indicators of unfolded protein accumulation suggest no relation with ethanol stress. (A) Autophagosome accumulation was observed in the BY4147 strain labeled with autophagosome marker Atg8-Gfp 6 h after 8% ethanol, 1 mM DTT or with no stress. Phase contrast and green fluorescence representative images are presented. White arrows indicate Atg8 foci. (B) The ER redox status was observed in the BY4147 strain labeled with the eroGFP marker after 8% ethanol, 1 mM DTT or with no stress. The EroGFP ratio was calculated at the different time points and was averaged. The standard deviations of the biological triplicates are represented.

