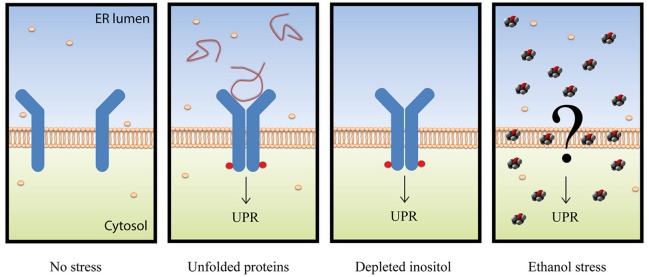
Figure 8.
Schematic representation of the different UPR activation mechanisms. The Ire1p sensor is represented in blue with red circles when phosphorylated. Unfolded proteins are represented with red lines, inositol molecules with cream-colored spheres, and ethanol is depicted by red, black and gray sphere molecules.

