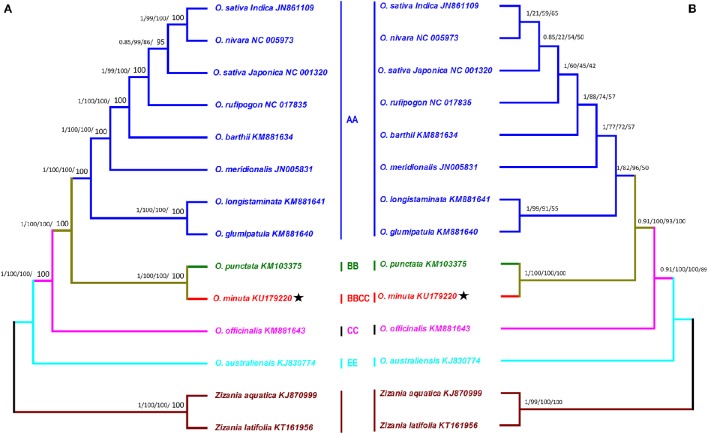
Figure 7.
Phylogenetic trees were constructed for 14 species from the rice tribe using different methods, and two Bayesian trees are shown for data sets of the entire genome sequence and 65 shared genes. (A) The entire genome sequence data set (B). The data set of 65 shared genes. Each data set was used with four different methods, Bayesian inference (BI), maximum parsimony (MP), maximum likelihood (ML) and neighbor-joining (NJ). Numbers above the branches are the posterior probabilities of BI and bootstrap values of MP, ML, and NJ, respectively. Stars represent positions for O. minuta (KU179220) in the two trees.

