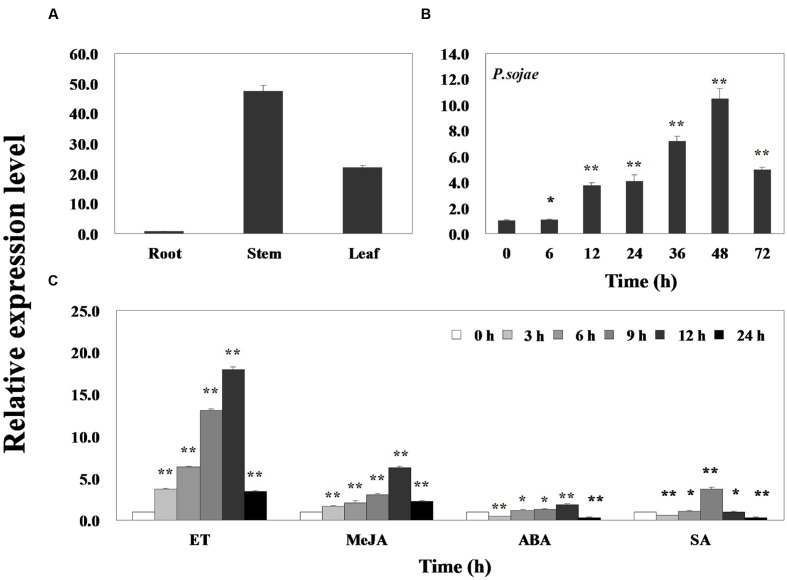
FIGURE 2.
Expression patterns of GmERF113 in soybean. Fourteen-day-old plants were collected for treatments and analyses. (A) GmERF113 mRNA levels in different tissues of soybean. Data were normalized to expression levels of soybean GmEF1β. (B) GmERF113 expression in soybean leaves infected with Phytophthora sojae for 0, 6, 12, 24, 36, 48, and 72 h. Data were normalized to expression levels of soybean GmActin4, and the relative expression of GmERF113 was compared with that in mock-treated plants at the same time points. (C) GmERF113 expression in soybean leaves in response to exogenous hormones: 100 μM MeJA, 100 μM ABA, and 500 μM SA and ET treatments at 0, 3, 6, 9, 12, and 24 h after the initiation of treatments. Data were normalized to expression levels of soybean GmActin4, and are expressed as relative to that in mock-treated plants at the same time points. Three biological replicates, with three technical replicates each were averaged and statistically analyzed using Student’s t-tests (∗P < 0.05, ∗∗P < 0.01). Bars indicate the standard error of the mean (SE).

