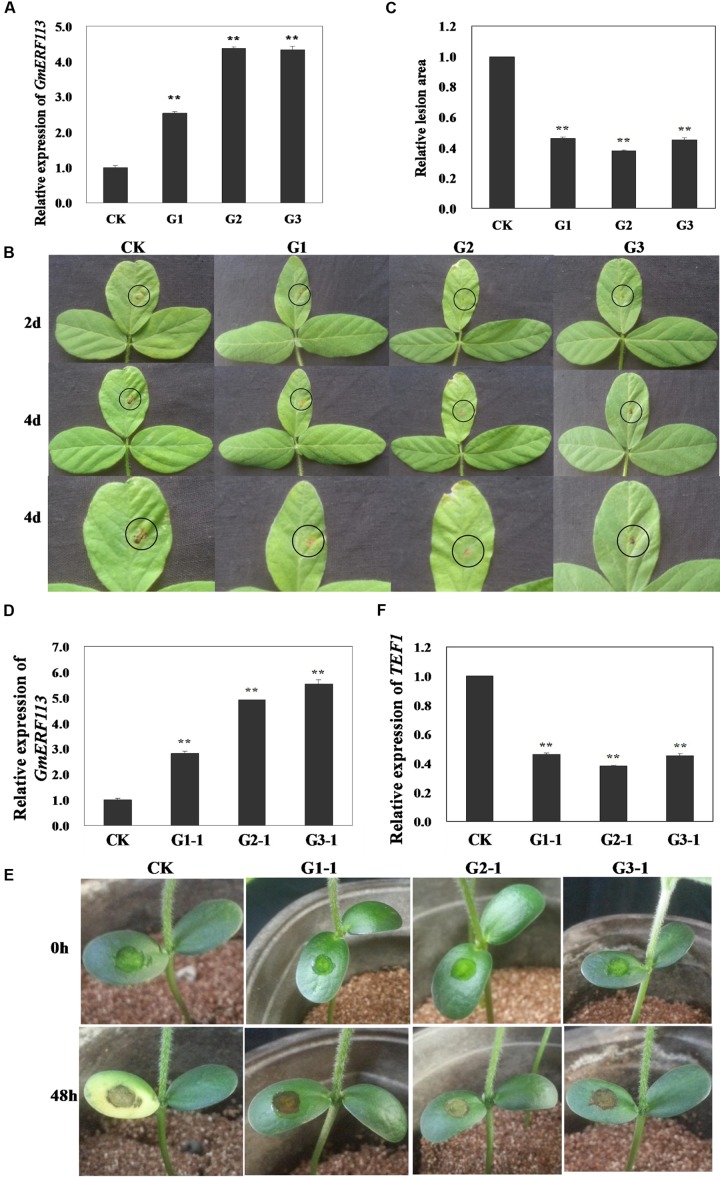
FIGURE 8.
Responses of living of GmERF113 transgenic soybean plants to P. sojae. (A) Quantitative real-time PCR (qRT-PCR) analysis of GmERF113 expression levels in T3 transgenic soybean plants. (B) Disease symptoms on the leaves of T3 transgenic and non-transgenic lines infected with P. sojae race 1 inoculum at 2 and 4 days. (C) The lesion areas of the transgenic and non-transgenic lines were determined 4 days after inoculation with P. sojae. (D) qRT-PCR analysis of GmERF113 expression levels in T4 transgenic soybean plants. (E) Disease symptoms on the cotyledons of T4 transgenic and non-transgenic lines 48 h after treatment with P. sojae zoospore suspension. (F) qRT-PCR analysis of P. sojae relative biomass based on the transcript level of the P. sojae TEF1 gene in infected cotyledons 48 h after incubation with P. sojae zoospore suspension. The experiment was performed using three biological replicates with three technical replicates each and statistically analyzed using Student’s t-tests (∗∗P < 0.01). Bars indicate standard error of the mean (SE).

