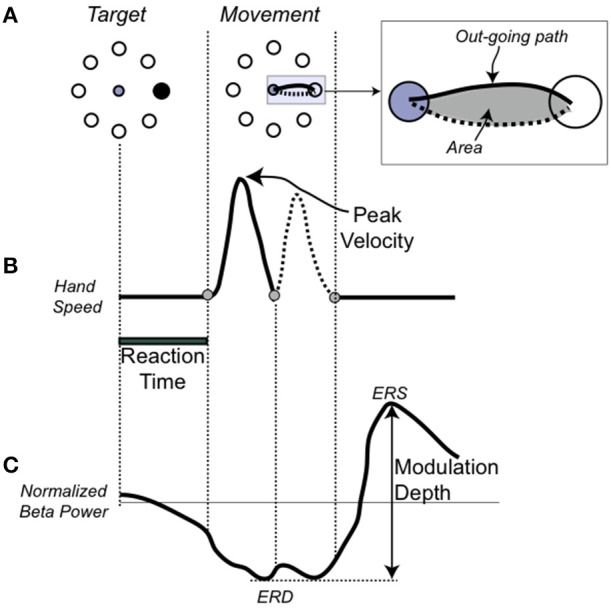
Figure 1.

Single movement, performance, and EEG measures (A). On the Left, the target array and in black, the target to be reached. In the center, the movement trajectory to the target. In the inset, the depiction of the hand path area (in gray) with the outgoing portion in a solid line and the return portion in dotted line. (B) Temporal profile of the trajectory. (C) Schematic representation of the beta modulation during a single movement with the definition of the event-related desynchronization (ERS), as the minimum amplitude of the beta power, event-related synchronization (ERD), as the maximum amplitude of the beta power, and modulation depth.
