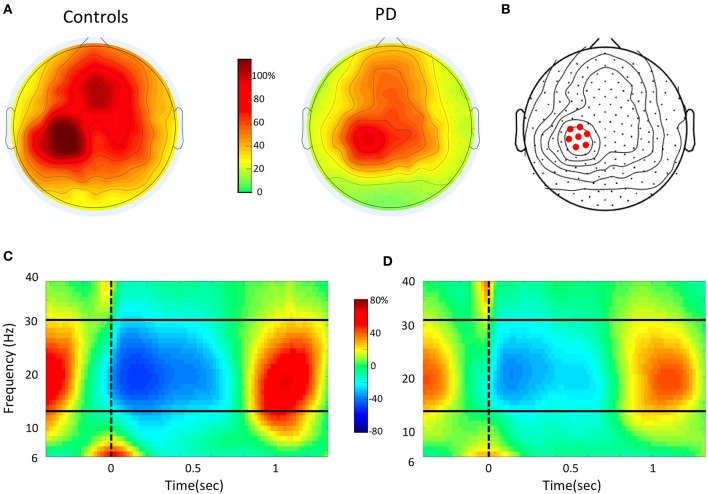
Figure 2.
EEG data analysis (A). Topographic distribution of the mean beta power (15–30 Hz) modulation depth (% change), as measured from maximal event-related desynchronization (ERD) to maximal event-related synchronization (ERS) in the Controls and PD groups. Topographies are averaged over all trials in each subject. The overall modulation is smaller in PD. However, in both maps there is a local maximum in Left sensory-motor area. (B) Identification of the left sensory-motor region of interest (ROI). The electrode with maximal modulation in the ROI is shown together with the six immediate neighbor electrodes. (C,D) Time-frequency plot for the event-related spectral change over the Left ROI obtained by averaging all trials of the control (C) and PD (D) groups. On the X-axis, 0 and the vertical dotted line indicate the time of the movement onset. The solid horizontal lines indicate the limits of the beta range. Notice that the strongest power modulation occurs in the beta range.

