
Figure 3.
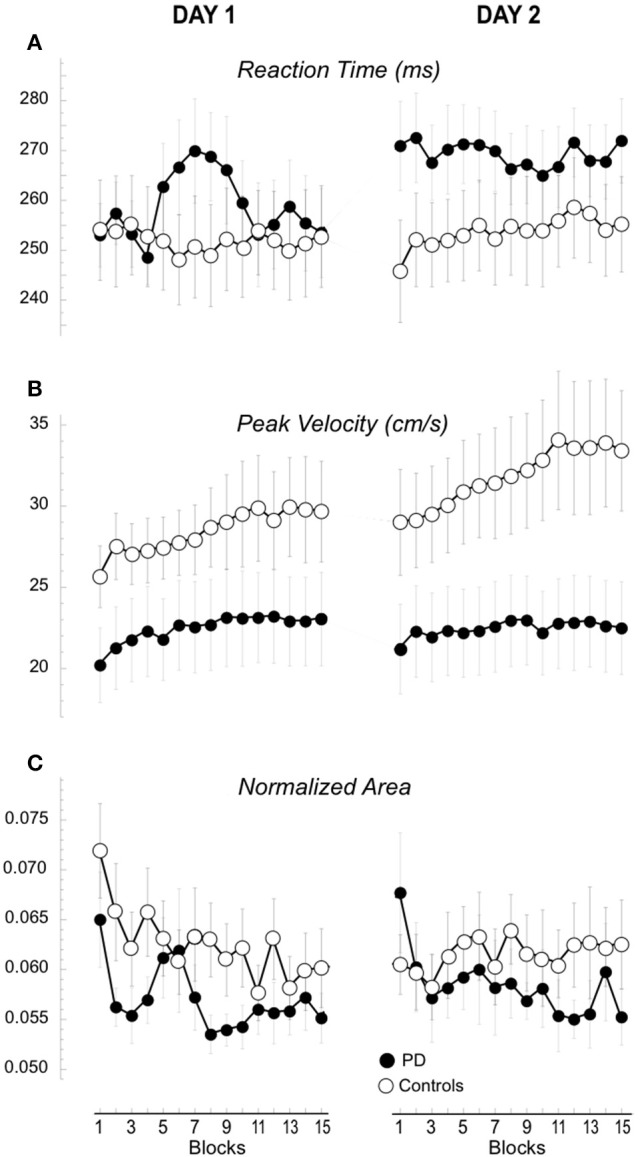
Performance measures of the 15 blocks in Day 1 and 2. Means (±SE) of the changes of reaction time (A), peak velocity (B), and hand path area (C) for each block are plotted separately for day 1 and 2 and for the two groups, the controls (empty circles) and the patients with PD (filled circles).